
Advertisement
The external fund manager backed by Berkshire Hathaway's Charlie Munger, Li Lu, makes no bones about it when he says 'The biggest investment risk is not the volatility of prices, but whether you will suffer a permanent loss of capital.' It's only natural to consider a company's balance sheet when you examine how risky it is, since debt is often involved when a business collapses. We note that Intrance Co.,Ltd. (TSE:3237) does have debt on its balance sheet. But the more important question is: how much risk is that debt creating?
When Is Debt Dangerous?
Generally speaking, debt only becomes a real problem when a company can't easily pay it off, either by raising capital or with its own cash flow. If things get really bad, the lenders can take control of the business. While that is not too common, we often do see indebted companies permanently diluting shareholders because lenders force them to raise capital at a distressed price. Of course, plenty of companies use debt to fund growth, without any negative consequences. The first step when considering a company's debt levels is to consider its cash and debt together.
Check out our latest analysis for IntranceLtd
What Is IntranceLtd's Debt?
The image below, which you can click on for greater detail, shows that at December 2023 IntranceLtd had debt of JP¥348.0m, up from JP¥326.0m in one year. However, its balance sheet shows it holds JP¥779.0m in cash, so it actually has JP¥431.0m net cash.
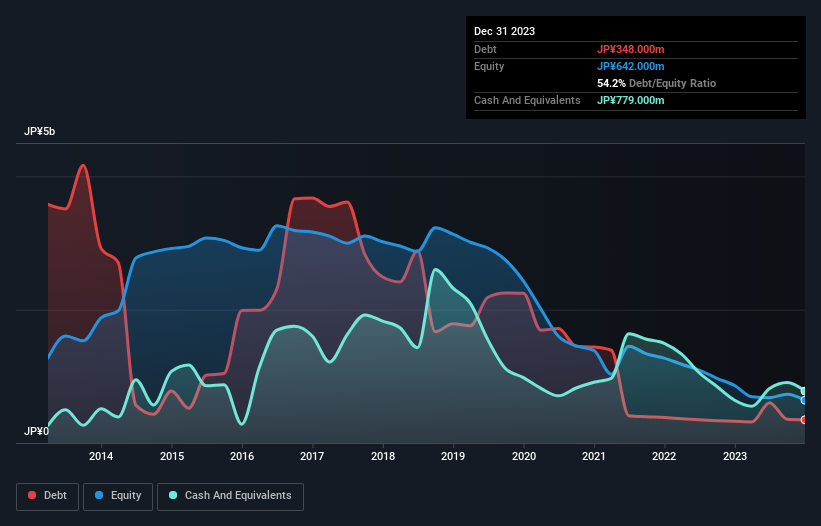
A Look At IntranceLtd's Liabilities
According to the last reported balance sheet, IntranceLtd had liabilities of JP¥195.0m due within 12 months, and liabilities of JP¥321.0m due beyond 12 months. Offsetting this, it had JP¥779.0m in cash and JP¥70.0m in receivables that were due within 12 months. So it actually has JP¥333.0m more liquid assets than total liabilities.
This short term liquidity is a sign that IntranceLtd could probably pay off its debt with ease, as its balance sheet is far from stretched. Succinctly put, IntranceLtd boasts net cash, so it's fair to say it does not have a heavy debt load! There's no doubt that we learn most about debt from the balance sheet. But it is IntranceLtd's earnings that will influence how the balance sheet holds up in the future. So when considering debt, it's definitely worth looking at the earnings trend. Click here for an interactive snapshot.
In the last year IntranceLtd wasn't profitable at an EBIT level, but managed to grow its revenue by 80%, to JP¥1.1b. Shareholders probably have their fingers crossed that it can grow its way to profits.
So How Risky Is IntranceLtd?
Although IntranceLtd had an earnings before interest and tax (EBIT) loss over the last twelve months, it generated positive free cash flow of JP¥11m. So taking that on face value, and considering the net cash situation, we don't think that the stock is too risky in the near term. We think its revenue growth of 80% is a good sign. We'd see further strong growth as an optimistic indication. When analysing debt levels, the balance sheet is the obvious place to start. But ultimately, every company can contain risks that exist outside of the balance sheet. For example, we've discovered 2 warning signs for IntranceLtd that you should be aware of before investing here.
If you're interested in investing in businesses that can grow profits without the burden of debt, then check out this free list of growing businesses that have net cash on the balance sheet.
New: AI Stock Screener & Alerts
Our new AI Stock Screener scans the market every day to uncover opportunities.
• Dividend Powerhouses (3%+ Yield)
• Undervalued Small Caps with Insider Buying
• High growth Tech and AI Companies
Or build your own from over 50 metrics.
Have feedback on this article? Concerned about the content? Get in touch with us directly. Alternatively, email editorial-team (at) simplywallst.com.
This article by Simply Wall St is general in nature. We provide commentary based on historical data and analyst forecasts only using an unbiased methodology and our articles are not intended to be financial advice. It does not constitute a recommendation to buy or sell any stock, and does not take account of your objectives, or your financial situation. We aim to bring you long-term focused analysis driven by fundamental data. Note that our analysis may not factor in the latest price-sensitive company announcements or qualitative material. Simply Wall St has no position in any stocks mentioned.
About TSE:3237
Excellent balance sheet with low risk.
Market Insights

Advertisement
Community Narratives
MicroVision will explode future revenue by 380.37% with a vision towards success
Fair Value US$60.00|98.5% undervalued
TH
Community Contributor
The Indispensable Artery for a New North American Economy
Fair Value CA$132.87|2.3% undervalued
TI
Community Contributor