Advertisement
- Japan
- /
- Real Estate
- /
- TSE:3003
Hulic (TSE:3003) Valuation in Focus After Upgraded Earnings and Dividend Forecasts for 2025

Simply Wall St
Reviewed by Simply Wall St
Hulic (TSE:3003) just raised its full-year earnings and dividend forecasts for 2025, driven by stronger-than-expected property sales and a strategic push to expand its high-quality leasing portfolio. The company now expects record-high results.
See our latest analysis for Hulic.
Hulic’s confidence has caught the market’s attention, with the share price up 15.6% since the start of the year and total shareholder return reaching nearly 66% over three years. Momentum appears to be building as recent guidance upgrades have fueled optimism about both future growth and income potential.
If property success stories like Hulic’s have you curious about what else is out there, now is a great time to discover fast growing stocks with high insider ownership.
But with shares near record highs and optimism building around Hulic’s upgraded forecasts, the big question now is whether the current price offers further upside for investors or if the market has already priced in that growth story.
Price-to-Earnings of 11.1x: Is it justified?
Hulic’s stock is currently trading at a price-to-earnings (P/E) ratio of 11.1x, which is lower than both its peers and the estimated fair P/E. At a last close of ¥1,590, the company stands out as comparatively inexpensive in this regard.
The P/E ratio indicates how much investors are willing to pay for each yen of earnings. For real estate firms like Hulic, this metric is a key gauge of how the market values near-term earnings versus expectations for growth, quality, and stability. A lower P/E can signal undervaluation, particularly if the market underappreciates consistent earnings growth or strong portfolio assets.
Compared to its Japanese real estate peers, Hulic’s P/E of 11.1x is well below the sector average of 16x. In addition, it trades at a notable discount to its fair estimated P/E of 16.7x, leaving substantial room for upward re-rating if recent growth and guidance upgrades translate into sustained performance. The market could eventually adjust closer to the fair ratio, reflecting the company's stronger growth trajectory and high-quality earnings.
Explore the SWS fair ratio for Hulic
Result: Price-to-Earnings of 11.1x (UNDERVALUED)
However, risks remain if Japan’s real estate market slows or if Hulic faces unexpected volatility in property values or rental demand.
Find out about the key risks to this Hulic narrative.
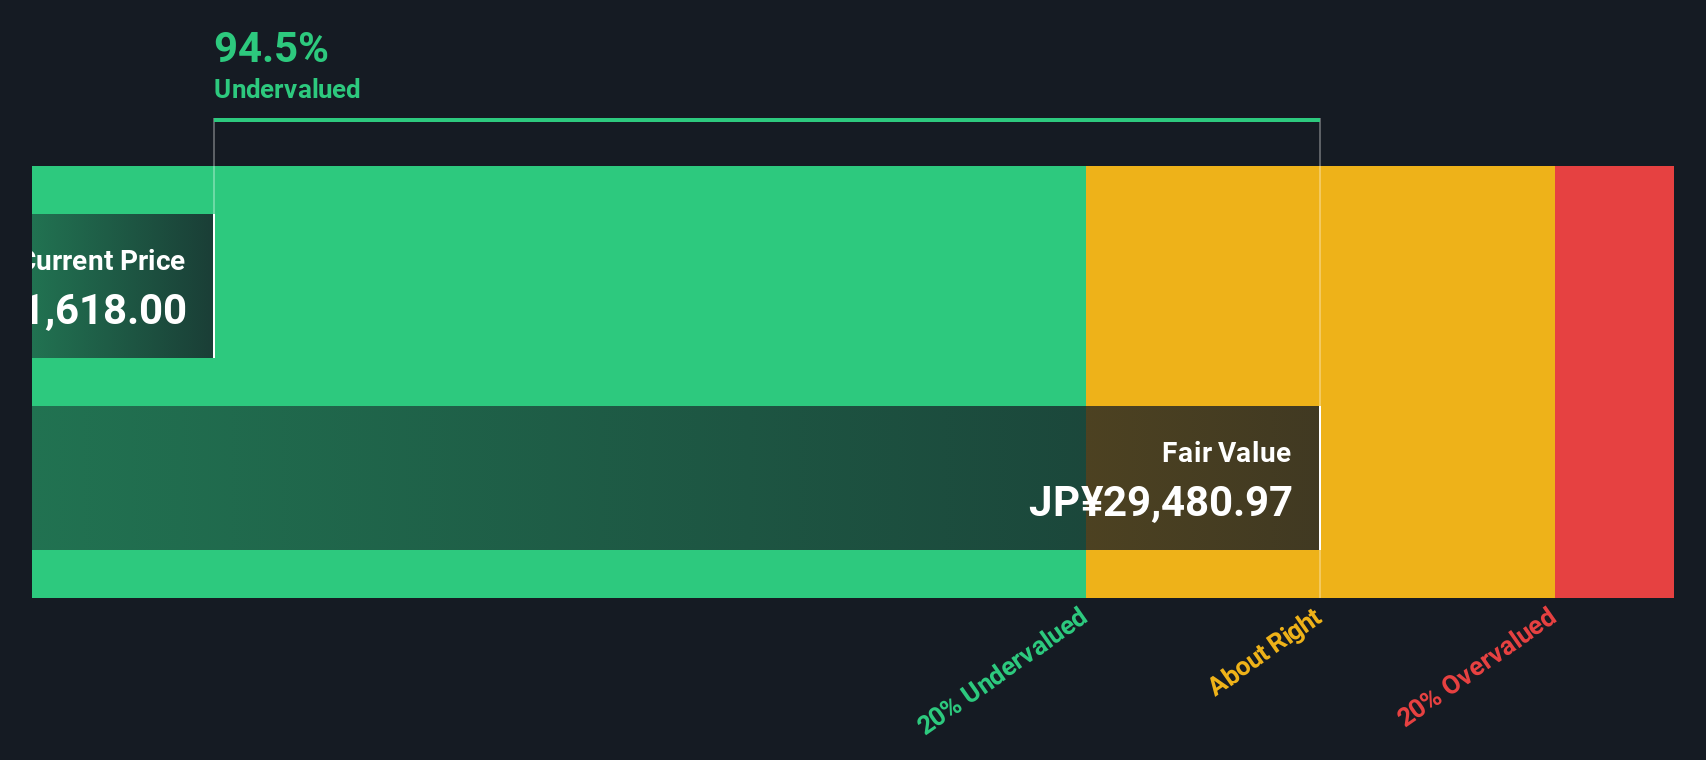
Another View: What Does the SWS DCF Model Suggest?
While Hulic's earnings multiple paints a picture of undervaluation, our DCF model offers a dramatically different perspective. According to the SWS DCF model, Hulic is trading well below its estimated fair value. This suggests the market may be underestimating its longer-term cash flow potential. Is the current price a temporary disconnect, or is caution warranted?
Look into how the SWS DCF model arrives at its fair value.
Simply Wall St performs a discounted cash flow (DCF) on every stock in the world every day (check out Hulic for example). We show the entire calculation in full. You can track the result in your watchlist or portfolio and be alerted when this changes, or use our stock screener to discover 840 undervalued stocks based on their cash flows. If you save a screener we even alert you when new companies match - so you never miss a potential opportunity.
Build Your Own Hulic Narrative
If you see things differently or want to dig into the numbers yourself, building your own perspective is quick and easy. Anyone can do it in just a few minutes. Do it your way
A great starting point for your Hulic research is our analysis highlighting 3 key rewards and 2 important warning signs that could impact your investment decision.
Looking for more investment ideas?
Smart investors are always ahead of the curve, so don’t let opportunity pass you by. Uncover strategies and stocks others are missing using the Simply Wall St Screener.
- Capitalize on the wave of innovation by checking out these 26 AI penny stocks that are harnessing artificial intelligence to drive rapid growth across multiple sectors.
- Strengthen your portfolio’s stability and income with these 22 dividend stocks with yields > 3% offering yields above 3%. This can be a great choice for long-term returns and resilience.
- Stay ahead of the crowd and spot overlooked value opportunities among these 840 undervalued stocks based on cash flows based on robust cash flow analysis and market potential.
This article by Simply Wall St is general in nature. We provide commentary based on historical data and analyst forecasts only using an unbiased methodology and our articles are not intended to be financial advice. It does not constitute a recommendation to buy or sell any stock, and does not take account of your objectives, or your financial situation. We aim to bring you long-term focused analysis driven by fundamental data. Note that our analysis may not factor in the latest price-sensitive company announcements or qualitative material. Simply Wall St has no position in any stocks mentioned.
Valuation is complex, but we're here to simplify it.
Discover if Hulic might be undervalued or overvalued with our detailed analysis, featuring fair value estimates, potential risks, dividends, insider trades, and its financial condition.
Access Free AnalysisHave feedback on this article? Concerned about the content? Get in touch with us directly. Alternatively, email editorial-team@simplywallst.com
About TSE:3003
Hulic
Engages in the holding, leasing, brokerage, and sale of real estate properties in Japan.
Established dividend payer and good value.
Market Insights

Advertisement
Community Narratives
The company that turned a verb into a global necessity and basically runs the modern internet, digital ads, smartphones, maps, and AI.
Fair Value US$300.00|6.3% undervalued
OS
Community Contributor
Flowers Foods Pays A Fair Price For Health
Fair Value US$16.12|26.0% undervalued
NV
Community Contributor
TMX Group will thrive with 33.3% profit margin and enduring market moat
Fair Value CA$49.90|3.7% overvalued
LI
Community Contributor