
Advertisement
Some say volatility, rather than debt, is the best way to think about risk as an investor, but Warren Buffett famously said that 'Volatility is far from synonymous with risk.' It's only natural to consider a company's balance sheet when you examine how risky it is, since debt is often involved when a business collapses. As with many other companies 3-D Matrix, Ltd. (TSE:7777) makes use of debt. But the more important question is: how much risk is that debt creating?
When Is Debt A Problem?
Debt is a tool to help businesses grow, but if a business is incapable of paying off its lenders, then it exists at their mercy. Part and parcel of capitalism is the process of 'creative destruction' where failed businesses are mercilessly liquidated by their bankers. However, a more usual (but still expensive) situation is where a company must dilute shareholders at a cheap share price simply to get debt under control. Of course, plenty of companies use debt to fund growth, without any negative consequences. When we think about a company's use of debt, we first look at cash and debt together.
See our latest analysis for 3-D Matrix
What Is 3-D Matrix's Net Debt?
The image below, which you can click on for greater detail, shows that 3-D Matrix had debt of JP¥4.17b at the end of April 2024, a reduction from JP¥4.37b over a year. However, it also had JP¥1.36b in cash, and so its net debt is JP¥2.81b.
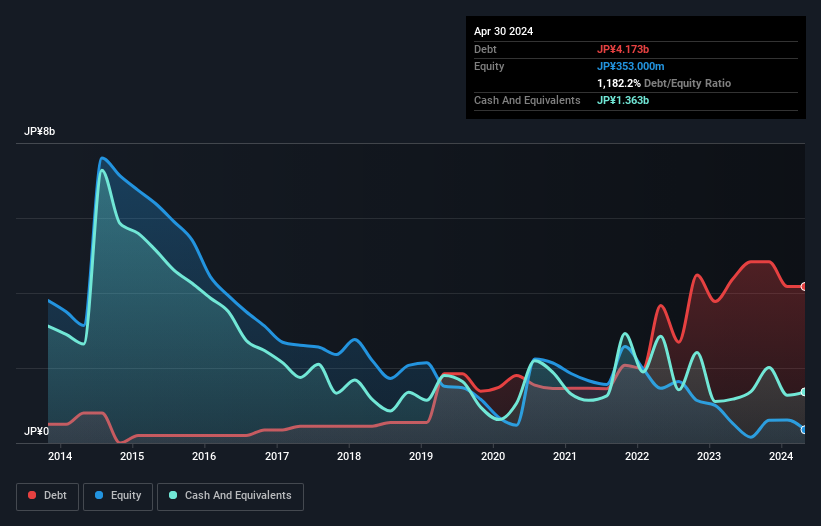
How Strong Is 3-D Matrix's Balance Sheet?
Zooming in on the latest balance sheet data, we can see that 3-D Matrix had liabilities of JP¥1.54b due within 12 months and liabilities of JP¥4.00b due beyond that. Offsetting this, it had JP¥1.36b in cash and JP¥1.17b in receivables that were due within 12 months. So its liabilities outweigh the sum of its cash and (near-term) receivables by JP¥3.00b.
3-D Matrix has a market capitalization of JP¥11.4b, so it could very likely raise cash to ameliorate its balance sheet, if the need arose. But it's clear that we should definitely closely examine whether it can manage its debt without dilution. The balance sheet is clearly the area to focus on when you are analysing debt. But it is 3-D Matrix's earnings that will influence how the balance sheet holds up in the future. So when considering debt, it's definitely worth looking at the earnings trend. Click here for an interactive snapshot.
Over 12 months, 3-D Matrix reported revenue of JP¥4.6b, which is a gain of 98%, although it did not report any earnings before interest and tax. With any luck the company will be able to grow its way to profitability.
Caveat Emptor
Even though 3-D Matrix managed to grow its top line quite deftly, the cold hard truth is that it is losing money on the EBIT line. Indeed, it lost a very considerable JP¥2.1b at the EBIT level. When we look at that and recall the liabilities on its balance sheet, relative to cash, it seems unwise to us for the company to have any debt. So we think its balance sheet is a little strained, though not beyond repair. However, it doesn't help that it burned through JP¥1.9b of cash over the last year. So suffice it to say we consider the stock very risky. There's no doubt that we learn most about debt from the balance sheet. However, not all investment risk resides within the balance sheet - far from it. To that end, you should learn about the 4 warning signs we've spotted with 3-D Matrix (including 1 which doesn't sit too well with us) .
If, after all that, you're more interested in a fast growing company with a rock-solid balance sheet, then check out our list of net cash growth stocks without delay.
Valuation is complex, but we're here to simplify it.
Discover if 3-D Matrix might be undervalued or overvalued with our detailed analysis, featuring fair value estimates, potential risks, dividends, insider trades, and its financial condition.
Access Free AnalysisHave feedback on this article? Concerned about the content? Get in touch with us directly. Alternatively, email editorial-team (at) simplywallst.com.
This article by Simply Wall St is general in nature. We provide commentary based on historical data and analyst forecasts only using an unbiased methodology and our articles are not intended to be financial advice. It does not constitute a recommendation to buy or sell any stock, and does not take account of your objectives, or your financial situation. We aim to bring you long-term focused analysis driven by fundamental data. Note that our analysis may not factor in the latest price-sensitive company announcements or qualitative material. Simply Wall St has no position in any stocks mentioned.
About TSE:7777
3-D Matrix
3-D Matrix, Ltd. developing, manufacturing, and selling self-assembling peptide technology in Japan and internationally.
Mediocre balance sheet with low risk.
Market Insights

Advertisement
Community Narratives
MINISO's fair value is projected at 26.69 with an anticipated PE ratio shift of 20x
Fair Value US$24.03|11.0% undervalued
BE
Community Contributor
Procter & Gamble: A Dividend Giant Facing Slowing Growth
Fair Value US$119.81|23.3% overvalued
AN
Community Contributor
Eli Lilly's Future Growth Driven by Tirzepatide and Favorable Market Conditions
Fair Value US$1.19k|13.8% undervalued
EA
Community Contributor