
Advertisement
Investors Continue Waiting On Sidelines For 3-D Matrix, Ltd. (TSE:7777)
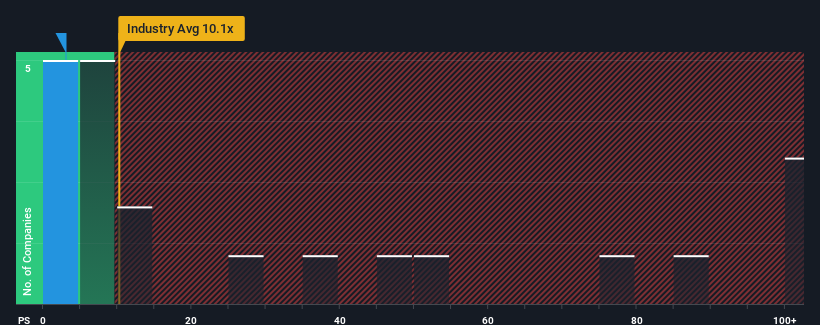
You may think that with a price-to-sales (or "P/S") ratio of 3x 3-D Matrix, Ltd. (TSE:7777) is definitely a stock worth checking out, seeing as almost half of all the Biotechs companies in Japan have P/S ratios greater than 10.1x and even P/S above 55x aren't out of the ordinary. Although, it's not wise to just take the P/S at face value as there may be an explanation why it's so limited.
Check out our latest analysis for 3-D Matrix
How 3-D Matrix Has Been Performing
With revenue growth that's exceedingly strong of late, 3-D Matrix has been doing very well. It might be that many expect the strong revenue performance to degrade substantially, which has repressed the P/S ratio. Those who are bullish on 3-D Matrix will be hoping that this isn't the case, so that they can pick up the stock at a lower valuation.
Want the full picture on earnings, revenue and cash flow for the company? Then our free report on 3-D Matrix will help you shine a light on its historical performance.How Is 3-D Matrix's Revenue Growth Trending?
There's an inherent assumption that a company should far underperform the industry for P/S ratios like 3-D Matrix's to be considered reasonable.
If we review the last year of revenue growth, the company posted a terrific increase of 71%. Pleasingly, revenue has also lifted 282% in aggregate from three years ago, thanks to the last 12 months of growth. Accordingly, shareholders would have definitely welcomed those medium-term rates of revenue growth.
This is in contrast to the rest of the industry, which is expected to grow by 36% over the next year, materially lower than the company's recent medium-term annualised growth rates.
With this in mind, we find it intriguing that 3-D Matrix's P/S isn't as high compared to that of its industry peers. It looks like most investors are not convinced the company can maintain its recent growth rates.
The Final Word
Using the price-to-sales ratio alone to determine if you should sell your stock isn't sensible, however it can be a practical guide to the company's future prospects.
We're very surprised to see 3-D Matrix currently trading on a much lower than expected P/S since its recent three-year growth is higher than the wider industry forecast. When we see robust revenue growth that outpaces the industry, we presume that there are notable underlying risks to the company's future performance, which is exerting downward pressure on the P/S ratio. While recent revenue trends over the past medium-term suggest that the risk of a price decline is low, investors appear to perceive a likelihood of revenue fluctuations in the future.
It's always necessary to consider the ever-present spectre of investment risk. We've identified 4 warning signs with 3-D Matrix (at least 1 which is potentially serious), and understanding these should be part of your investment process.
If companies with solid past earnings growth is up your alley, you may wish to see this free collection of other companies with strong earnings growth and low P/E ratios.
Valuation is complex, but we're here to simplify it.
Discover if 3-D Matrix might be undervalued or overvalued with our detailed analysis, featuring fair value estimates, potential risks, dividends, insider trades, and its financial condition.
Access Free AnalysisHave feedback on this article? Concerned about the content? Get in touch with us directly. Alternatively, email editorial-team (at) simplywallst.com.
This article by Simply Wall St is general in nature. We provide commentary based on historical data and analyst forecasts only using an unbiased methodology and our articles are not intended to be financial advice. It does not constitute a recommendation to buy or sell any stock, and does not take account of your objectives, or your financial situation. We aim to bring you long-term focused analysis driven by fundamental data. Note that our analysis may not factor in the latest price-sensitive company announcements or qualitative material. Simply Wall St has no position in any stocks mentioned.
About TSE:7777
3-D Matrix
3-D Matrix, Ltd. developing, manufacturing, and selling self-assembling peptide technology in Japan and internationally.
Mediocre balance sheet with low risk.
Market Insights

Advertisement
Community Narratives
MINISO's fair value is projected at 26.69 with an anticipated PE ratio shift of 20x
Fair Value US$24.03|11.0% undervalued
BE
Community Contributor
Procter & Gamble: A Dividend Giant Facing Slowing Growth
Fair Value US$119.81|23.3% overvalued
AN
Community Contributor
Eli Lilly's Future Growth Driven by Tirzepatide and Favorable Market Conditions
Fair Value US$1.19k|13.8% undervalued
EA
Community Contributor