
Advertisement
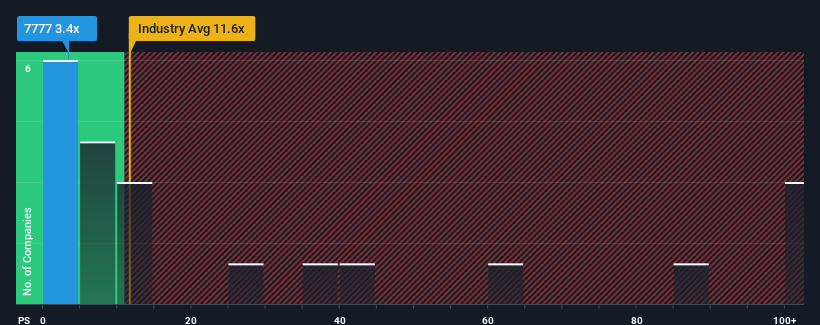
You may think that with a price-to-sales (or "P/S") ratio of 3.4x 3-D Matrix, Ltd. (TSE:7777) is definitely a stock worth checking out, seeing as almost half of all the Biotechs companies in Japan have P/S ratios greater than 11.6x and even P/S above 42x aren't out of the ordinary. However, the P/S might be quite low for a reason and it requires further investigation to determine if it's justified.
See our latest analysis for 3-D Matrix
What Does 3-D Matrix's Recent Performance Look Like?
3-D Matrix certainly has been doing a great job lately as it's been growing its revenue at a really rapid pace. One possibility is that the P/S ratio is low because investors think this strong revenue growth might actually underperform the broader industry in the near future. If you like the company, you'd be hoping this isn't the case so that you could potentially pick up some stock while it's out of favour.
We don't have analyst forecasts, but you can see how recent trends are setting up the company for the future by checking out our free report on 3-D Matrix's earnings, revenue and cash flow.Do Revenue Forecasts Match The Low P/S Ratio?
The only time you'd be truly comfortable seeing a P/S as depressed as 3-D Matrix's is when the company's growth is on track to lag the industry decidedly.
Taking a look back first, we see that the company grew revenue by an impressive 81% last year. Spectacularly, three year revenue growth has ballooned by several orders of magnitude, thanks in part to the last 12 months of revenue growth. Therefore, it's fair to say the revenue growth recently has been superb for the company.
Comparing that recent medium-term revenue trajectory with the industry's one-year growth forecast of 46% shows it's noticeably more attractive.
With this information, we find it odd that 3-D Matrix is trading at a P/S lower than the industry. Apparently some shareholders believe the recent performance has exceeded its limits and have been accepting significantly lower selling prices.
The Final Word
Typically, we'd caution against reading too much into price-to-sales ratios when settling on investment decisions, though it can reveal plenty about what other market participants think about the company.
We're very surprised to see 3-D Matrix currently trading on a much lower than expected P/S since its recent three-year growth is higher than the wider industry forecast. When we see strong revenue with faster-than-industry growth, we assume there are some significant underlying risks to the company's ability to make money which is applying downwards pressure on the P/S ratio. At least price risks look to be very low if recent medium-term revenue trends continue, but investors seem to think future revenue could see a lot of volatility.
Before you take the next step, you should know about the 3 warning signs for 3-D Matrix that we have uncovered.
If these risks are making you reconsider your opinion on 3-D Matrix, explore our interactive list of high quality stocks to get an idea of what else is out there.
Valuation is complex, but we're here to simplify it.
Discover if 3-D Matrix might be undervalued or overvalued with our detailed analysis, featuring fair value estimates, potential risks, dividends, insider trades, and its financial condition.
Access Free AnalysisHave feedback on this article? Concerned about the content? Get in touch with us directly. Alternatively, email editorial-team (at) simplywallst.com.
This article by Simply Wall St is general in nature. We provide commentary based on historical data and analyst forecasts only using an unbiased methodology and our articles are not intended to be financial advice. It does not constitute a recommendation to buy or sell any stock, and does not take account of your objectives, or your financial situation. We aim to bring you long-term focused analysis driven by fundamental data. Note that our analysis may not factor in the latest price-sensitive company announcements or qualitative material. Simply Wall St has no position in any stocks mentioned.
About TSE:7777
3-D Matrix
3-D Matrix, Ltd. developing, manufacturing, and selling self-assembling peptide technology in Japan and internationally.
Mediocre balance sheet with low risk.
Market Insights

Advertisement
Community Narratives
MINISO's fair value is projected at 26.69 with an anticipated PE ratio shift of 20x
Fair Value US$24.03|11.0% undervalued
BE
Community Contributor
Procter & Gamble: A Dividend Giant Facing Slowing Growth
Fair Value US$119.81|23.3% overvalued
AN
Community Contributor
Eli Lilly's Future Growth Driven by Tirzepatide and Favorable Market Conditions
Fair Value US$1.19k|13.8% undervalued
EA
Community Contributor