Advertisement
Ono Pharmaceutical (TSE:4528): Assessing Valuation Following New Phase 3 Data on Vimseltinib in TGCT

Simply Wall St
Reviewed by Simply Wall St
Ono Pharmaceutical (TSE:4528) is in the spotlight after sharing two-year results from its MOTION Phase 3 study of vimseltinib in TGCT patients at the ESMO Congress. The company highlighted new data on efficacy and safety.
See our latest analysis for Ono Pharmaceutical.
Fresh trial results appear to have caught investors’ attention, with Ono Pharmaceutical’s share price climbing over 10% in the past month and more than 14% over the last 90 days. While this momentum signals renewed optimism, it follows a longer stretch of underperformance. The stock’s total shareholder return remains negative over three and five years even after these recent gains.
If these clinical developments have you exploring what's next, you can uncover more promising opportunities with our healthcare stocks screener: See the full list for free.
With shares rallying on the back of encouraging trial results, investors are left wondering whether Ono Pharmaceutical is now trading below its true value or if the market is already factoring in future growth prospects.
Price-to-Earnings of 20.5x: Is it justified?
Ono Pharmaceutical is currently trading at a price-to-earnings (P/E) ratio of 20.5x, which can signal mixed messages compared to both the market and its peers. At ¥1,874.5 per share, investors are paying a premium that stands above several benchmarks.
The price-to-earnings ratio measures how much investors are willing to pay per yen of earnings and is widely used to gauge whether a stock is valued reasonably. For a pharmaceutical company like Ono, the multiple may reflect expectations for future drug approvals, growth potential, and earnings consistency. It can also highlight where the market is being optimistic about future gains or potentially overlooking key challenges.
Currently, Ono Pharmaceutical’s P/E ratio is below the peer average of 27.1x but above the broader Japanese Pharmaceuticals sector average of 14.9x. However, the estimated fair price-to-earnings ratio is 18.8x. This suggests that the market is pricing in more optimism than our benchmarks support and could recalibrate if earnings do not accelerate. This difference marks a premium that investors should scrutinize closely.
Explore the SWS fair ratio for Ono Pharmaceutical
Result: Price-to-Earnings of 20.5x (OVERVALUED)
However, weaker revenue growth and a significant discount to analyst price targets could quickly reverse sentiment if clinical momentum slows or expectations disappoint.
Find out about the key risks to this Ono Pharmaceutical narrative.
Another View: Discounted Cash Flow Outlook
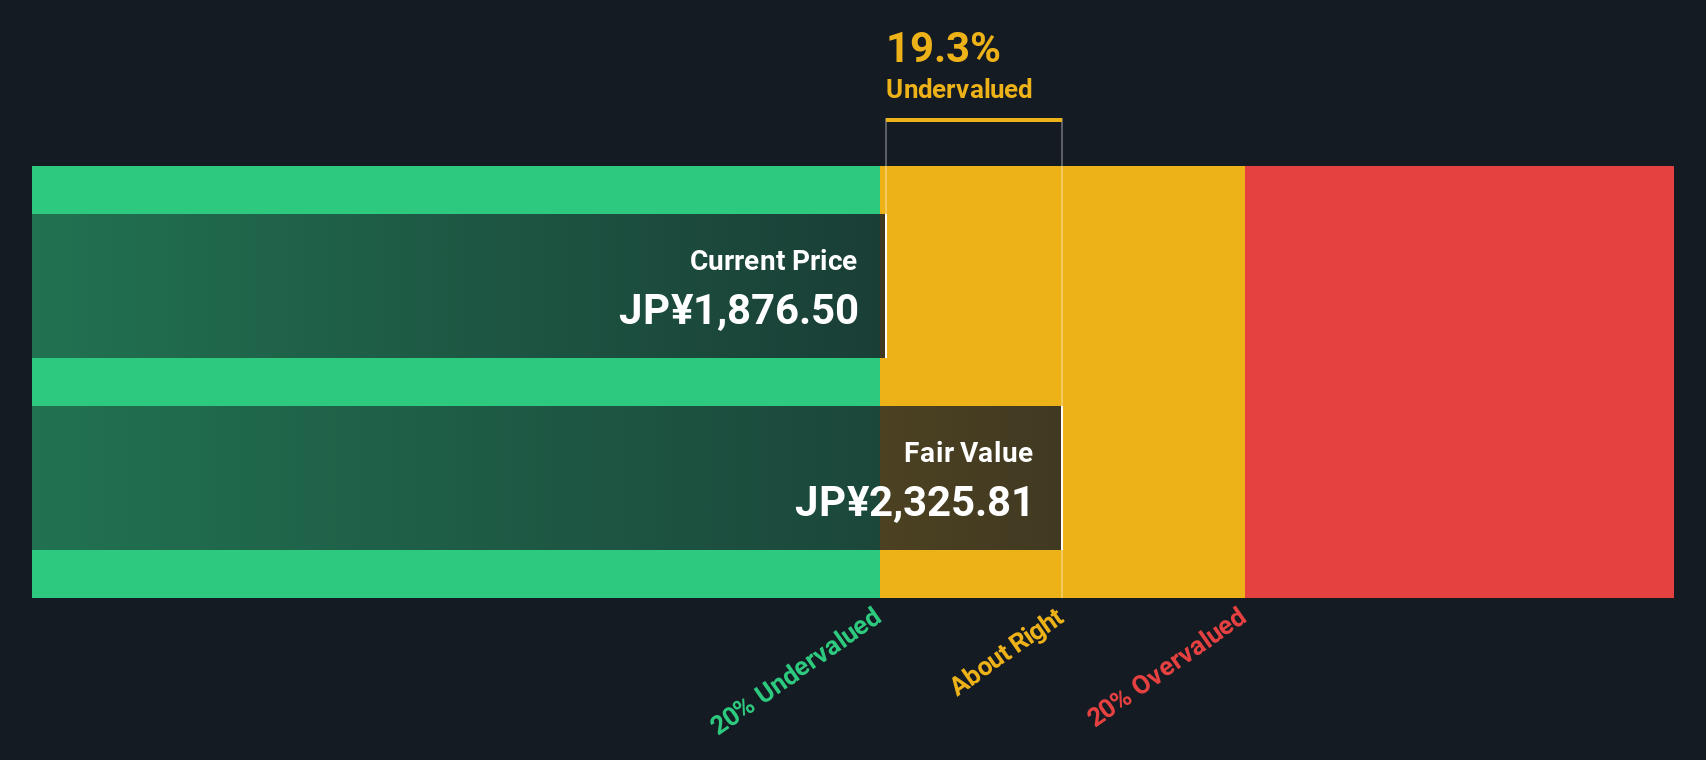
Switching from earnings multiples to our SWS DCF model offers a new perspective. This approach estimates Ono Pharmaceutical’s fair value at ¥2,325.81 per share, which is nearly 19.4% higher than current market prices. Does this signal a hidden bargain, or is the market cautious for a reason?
Look into how the SWS DCF model arrives at its fair value.
Simply Wall St performs a discounted cash flow (DCF) on every stock in the world every day (check out Ono Pharmaceutical for example). We show the entire calculation in full. You can track the result in your watchlist or portfolio and be alerted when this changes, or use our stock screener to discover 848 undervalued stocks based on their cash flows. If you save a screener we even alert you when new companies match - so you never miss a potential opportunity.
Build Your Own Ono Pharmaceutical Narrative
If you prefer your own analysis over consensus or want to chart a unique path, you can craft your own financial narrative in just minutes, Do it your way
A great starting point for your Ono Pharmaceutical research is our analysis highlighting 1 key reward and 2 important warning signs that could impact your investment decision.
Looking for more investment ideas?
Smart investors know the real advantage comes from looking beyond the obvious choices. Expand your portfolio’s potential with carefully selected stocks using Simply Wall Street’s powerful tools.
- Tap into reliable income streams by following the latest market movers with these 21 dividend stocks with yields > 3%, and spot stocks paying yields over 3%.
- Seize the explosive growth in artificial intelligence by checking out these 26 AI penny stocks, which are paving the way with real-world applications and rapid innovation.
- Uncover hidden value by finding these 848 undervalued stocks based on cash flows trading below their cash flow potential before the rest of the market catches on.
This article by Simply Wall St is general in nature. We provide commentary based on historical data and analyst forecasts only using an unbiased methodology and our articles are not intended to be financial advice. It does not constitute a recommendation to buy or sell any stock, and does not take account of your objectives, or your financial situation. We aim to bring you long-term focused analysis driven by fundamental data. Note that our analysis may not factor in the latest price-sensitive company announcements or qualitative material. Simply Wall St has no position in any stocks mentioned.
New: AI Stock Screener & Alerts
Our new AI Stock Screener scans the market every day to uncover opportunities.
• Dividend Powerhouses (3%+ Yield)
• Undervalued Small Caps with Insider Buying
• High growth Tech and AI Companies
Or build your own from over 50 metrics.
Have feedback on this article? Concerned about the content? Get in touch with us directly. Alternatively, email editorial-team@simplywallst.com
About TSE:4528
Ono Pharmaceutical
Produces, purchases, and sells pharmaceuticals and diagnostic reagents worldwide.
6 star dividend payer with excellent balance sheet.
Similar Companies
Market Insights

Advertisement
Community Narratives
The company that turned a verb into a global necessity and basically runs the modern internet, digital ads, smartphones, maps, and AI.
Fair Value US$300.00|6.2% undervalued
OS
Community Contributor
Flowers Foods Pays A Fair Price For Health
Fair Value US$16.12|25.1% undervalued
NV
Community Contributor
TMX Group will thrive with 33.3% profit margin and enduring market moat
Fair Value CA$49.90|0.04% overvalued
LI
Community Contributor