
Advertisement
Nippon Shinyaku Co., Ltd.'s (TSE:4516) Intrinsic Value Is Potentially 23% Below Its Share Price
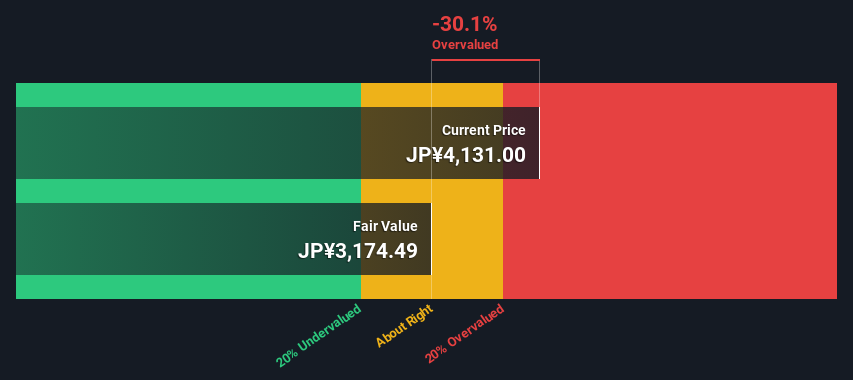
Key Insights
- Nippon Shinyaku's estimated fair value is JP¥3,174 based on 2 Stage Free Cash Flow to Equity
- Current share price of JP¥4,131 suggests Nippon Shinyaku is potentially 30% overvalued
- Our fair value estimate is 15% lower than Nippon Shinyaku's analyst price target of JP¥3,731
In this article we are going to estimate the intrinsic value of Nippon Shinyaku Co., Ltd. (TSE:4516) by taking the expected future cash flows and discounting them to today's value. The Discounted Cash Flow (DCF) model is the tool we will apply to do this. It may sound complicated, but actually it is quite simple!
We generally believe that a company's value is the present value of all of the cash it will generate in the future. However, a DCF is just one valuation metric among many, and it is not without flaws. If you want to learn more about discounted cash flow, the rationale behind this calculation can be read in detail in the Simply Wall St analysis model.
Check out our latest analysis for Nippon Shinyaku
What's The Estimated Valuation?
We're using the 2-stage growth model, which simply means we take in account two stages of company's growth. In the initial period the company may have a higher growth rate and the second stage is usually assumed to have a stable growth rate. In the first stage we need to estimate the cash flows to the business over the next ten years. Where possible we use analyst estimates, but when these aren't available we extrapolate the previous free cash flow (FCF) from the last estimate or reported value. We assume companies with shrinking free cash flow will slow their rate of shrinkage, and that companies with growing free cash flow will see their growth rate slow, over this period. We do this to reflect that growth tends to slow more in the early years than it does in later years.
A DCF is all about the idea that a dollar in the future is less valuable than a dollar today, and so the sum of these future cash flows is then discounted to today's value:
10-year free cash flow (FCF) estimate
| 2025 | 2026 | 2027 | 2028 | 2029 | 2030 | 2031 | 2032 | 2033 | 2034 | |
| Levered FCF (¥, Millions) | JP¥22.6b | JP¥21.9b | JP¥19.6b | JP¥9.68b | JP¥8.54b | JP¥7.85b | JP¥7.42b | JP¥7.14b | JP¥6.95b | JP¥6.83b |
| Growth Rate Estimate Source | Analyst x2 | Analyst x3 | Analyst x3 | Analyst x3 | Analyst x2 | Est @ -8.00% | Est @ -5.52% | Est @ -3.79% | Est @ -2.57% | Est @ -1.72% |
| Present Value (¥, Millions) Discounted @ 4.2% | JP¥21.7k | JP¥20.1k | JP¥17.3k | JP¥8.2k | JP¥6.9k | JP¥6.1k | JP¥5.5k | JP¥5.1k | JP¥4.8k | JP¥4.5k |
("Est" = FCF growth rate estimated by Simply Wall St)
Present Value of 10-year Cash Flow (PVCF) = JP¥100b
The second stage is also known as Terminal Value, this is the business's cash flow after the first stage. For a number of reasons a very conservative growth rate is used that cannot exceed that of a country's GDP growth. In this case we have used the 5-year average of the 10-year government bond yield (0.3%) to estimate future growth. In the same way as with the 10-year 'growth' period, we discount future cash flows to today's value, using a cost of equity of 4.2%.
Terminal Value (TV)= FCF2034 × (1 + g) ÷ (r – g) = JP¥6.8b× (1 + 0.3%) ÷ (4.2%– 0.3%) = JP¥172b
Present Value of Terminal Value (PVTV)= TV / (1 + r)10= JP¥172b÷ ( 1 + 4.2%)10= JP¥114b
The total value is the sum of cash flows for the next ten years plus the discounted terminal value, which results in the Total Equity Value, which in this case is JP¥214b. In the final step we divide the equity value by the number of shares outstanding. Compared to the current share price of JP¥4.1k, the company appears reasonably expensive at the time of writing. Valuations are imprecise instruments though, rather like a telescope - move a few degrees and end up in a different galaxy. Do keep this in mind.
The Assumptions
The calculation above is very dependent on two assumptions. The first is the discount rate and the other is the cash flows. You don't have to agree with these inputs, I recommend redoing the calculations yourself and playing with them. The DCF also does not consider the possible cyclicality of an industry, or a company's future capital requirements, so it does not give a full picture of a company's potential performance. Given that we are looking at Nippon Shinyaku as potential shareholders, the cost of equity is used as the discount rate, rather than the cost of capital (or weighted average cost of capital, WACC) which accounts for debt. In this calculation we've used 4.2%, which is based on a levered beta of 0.800. Beta is a measure of a stock's volatility, compared to the market as a whole. We get our beta from the industry average beta of globally comparable companies, with an imposed limit between 0.8 and 2.0, which is a reasonable range for a stable business.
SWOT Analysis for Nippon Shinyaku
Strength
- Earnings growth over the past year exceeded the industry.
- Currently debt free.
Weakness
- Dividend is low compared to the top 25% of dividend payers in the Pharmaceuticals market.
Opportunity
- Good value based on P/E ratio compared to estimated Fair P/E ratio.
Threat
- Dividends are not covered by cash flow.
- Annual earnings are forecast to decline for the next 3 years.
Next Steps:
Whilst important, the DCF calculation shouldn't be the only metric you look at when researching a company. It's not possible to obtain a foolproof valuation with a DCF model. Instead the best use for a DCF model is to test certain assumptions and theories to see if they would lead to the company being undervalued or overvalued. For instance, if the terminal value growth rate is adjusted slightly, it can dramatically alter the overall result. Why is the intrinsic value lower than the current share price? For Nippon Shinyaku, we've put together three fundamental elements you should further research:
- Risks: Be aware that Nippon Shinyaku is showing 2 warning signs in our investment analysis , and 1 of those can't be ignored...
- Future Earnings: How does 4516's growth rate compare to its peers and the wider market? Dig deeper into the analyst consensus number for the upcoming years by interacting with our free analyst growth expectation chart.
- Other High Quality Alternatives: Do you like a good all-rounder? Explore our interactive list of high quality stocks to get an idea of what else is out there you may be missing!
PS. The Simply Wall St app conducts a discounted cash flow valuation for every stock on the TSE every day. If you want to find the calculation for other stocks just search here.
Valuation is complex, but we're here to simplify it.
Discover if Nippon Shinyaku might be undervalued or overvalued with our detailed analysis, featuring fair value estimates, potential risks, dividends, insider trades, and its financial condition.
Access Free AnalysisHave feedback on this article? Concerned about the content? Get in touch with us directly. Alternatively, email editorial-team (at) simplywallst.com.
This article by Simply Wall St is general in nature. We provide commentary based on historical data and analyst forecasts only using an unbiased methodology and our articles are not intended to be financial advice. It does not constitute a recommendation to buy or sell any stock, and does not take account of your objectives, or your financial situation. We aim to bring you long-term focused analysis driven by fundamental data. Note that our analysis may not factor in the latest price-sensitive company announcements or qualitative material. Simply Wall St has no position in any stocks mentioned.
About TSE:4516
Nippon Shinyaku
Manufactures and sells pharmaceuticals and foodstuffs in Japan and internationally.
Flawless balance sheet with solid track record and pays a dividend.
Similar Companies
Market Insights

Advertisement
Community Narratives
MicroVision will explode future revenue by 380.37% with a vision towards success
Fair Value US$60.00|98.5% undervalued
TH
Community Contributor
The Indispensable Artery for a New North American Economy
Fair Value CA$132.87|2.3% undervalued
TI
Community Contributor