Advertisement
How Recent Pipeline Expansions Could Impact Takeda’s Stock Value in 2025

Simply Wall St
Reviewed by Bailey Pemberton
Thinking about what to do with Takeda Pharmaceutical stock? You’re not alone. Whether you currently hold shares or are sizing up an opportunity, it’s always wise to pause and look closely at what’s changed and what that could mean for where this stock is headed. Over the past five years, Takeda’s price has climbed 66.6%, and just in the past year, it’s up nearly 10%. Shorter-term moves tell a more mixed story: the stock is up 2.7% over the last week, but still down 3.4% for the past month. These swings are catching investor attention, and not without good reason.
Behind these numbers, several recent developments have added new context. Takeda has been in the news for expanding its rare disease pipeline, with positive regulatory updates in both the US and Europe. This focus on innovation is being watched closely by the market, since it could support future growth and help explain some of the resilience and optimism seen in medium and long-term returns, even as short-term sentiment shifts.
Of course, price moves only tell half the story. With a current value score of just 2 out of 6 on standard valuation checks, Takeda doesn’t immediately jump out as deeply undervalued. Still, there’s nuance here worth unpacking. Next, we’ll break down the major ways analysts assess valuation for Takeda’s stock and hint at a unique angle that might give savvy investors an even clearer picture by the end of this article.
Takeda Pharmaceutical scores just 2/6 on our valuation checks. See what other red flags we found in the full valuation breakdown.
Approach 1: Takeda Pharmaceutical Discounted Cash Flow (DCF) Analysis
The Discounted Cash Flow (DCF) model estimates a company's value by forecasting its future cash flows and then discounting them back to reflect their value today. For Takeda Pharmaceutical, this approach uses a two-stage free cash flow to equity framework, projecting both near-term and long-term cash flows in yen (¥).
Currently, Takeda’s Free Cash Flow (FCF) sits at ¥606.7 billion. Analysts provide annual FCF estimates for the next five years, such as ¥818.3 billion in 2026 and ¥848.2 billion in 2030, with further projections extrapolated by Simply Wall St for later years. These rising figures suggest cautious but persistent cash flow growth over time.
The DCF model pegs Takeda’s intrinsic value at ¥13,523 per share. Comparing this with the current stock price, the implied discount stands at 68.2%, indicating the stock is significantly undervalued according to this method.
Result: UNDERVALUED
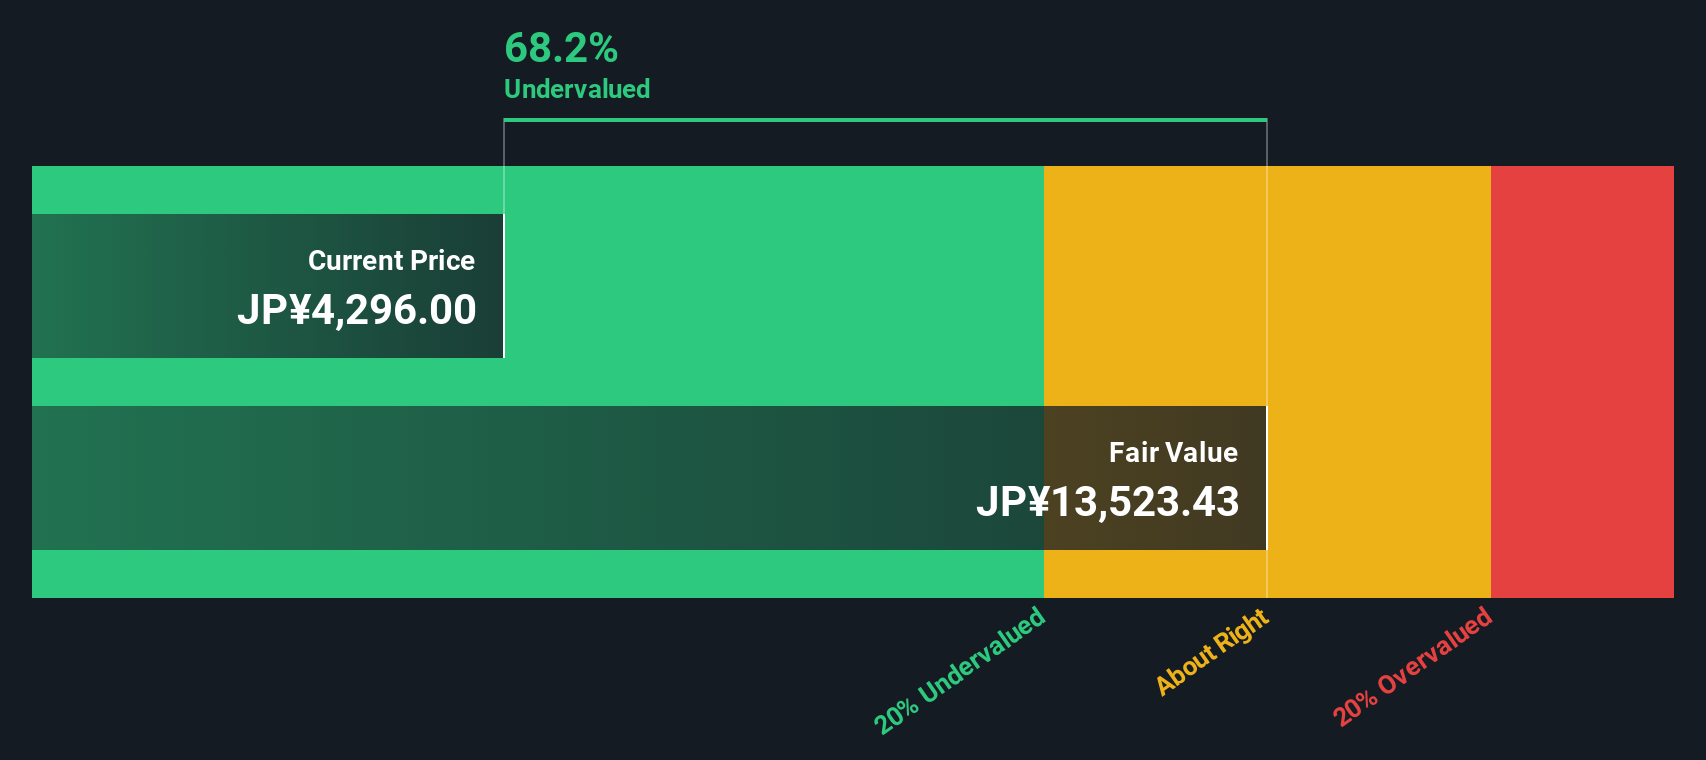
Our Discounted Cash Flow (DCF) analysis suggests Takeda Pharmaceutical is undervalued by 68.2%. Track this in your watchlist or portfolio, or discover more undervalued stocks.
Approach 2: Takeda Pharmaceutical Price vs Earnings
The Price-to-Earnings (PE) ratio is the preferred multiple for valuing profitable companies like Takeda Pharmaceutical because it directly relates the company’s share price to its net earnings. This makes it a straightforward way for investors to weigh how much they are paying for each unit of earnings, which is especially useful when a company is consistently profitable.
A “normal” or “fair” PE ratio varies from company to company and industry to industry, influenced by growth prospects and risks. Fast-growing companies or those with lower risk profiles can typically justify higher PE ratios, while slower growers or riskier firms generally trade at lower multiples.
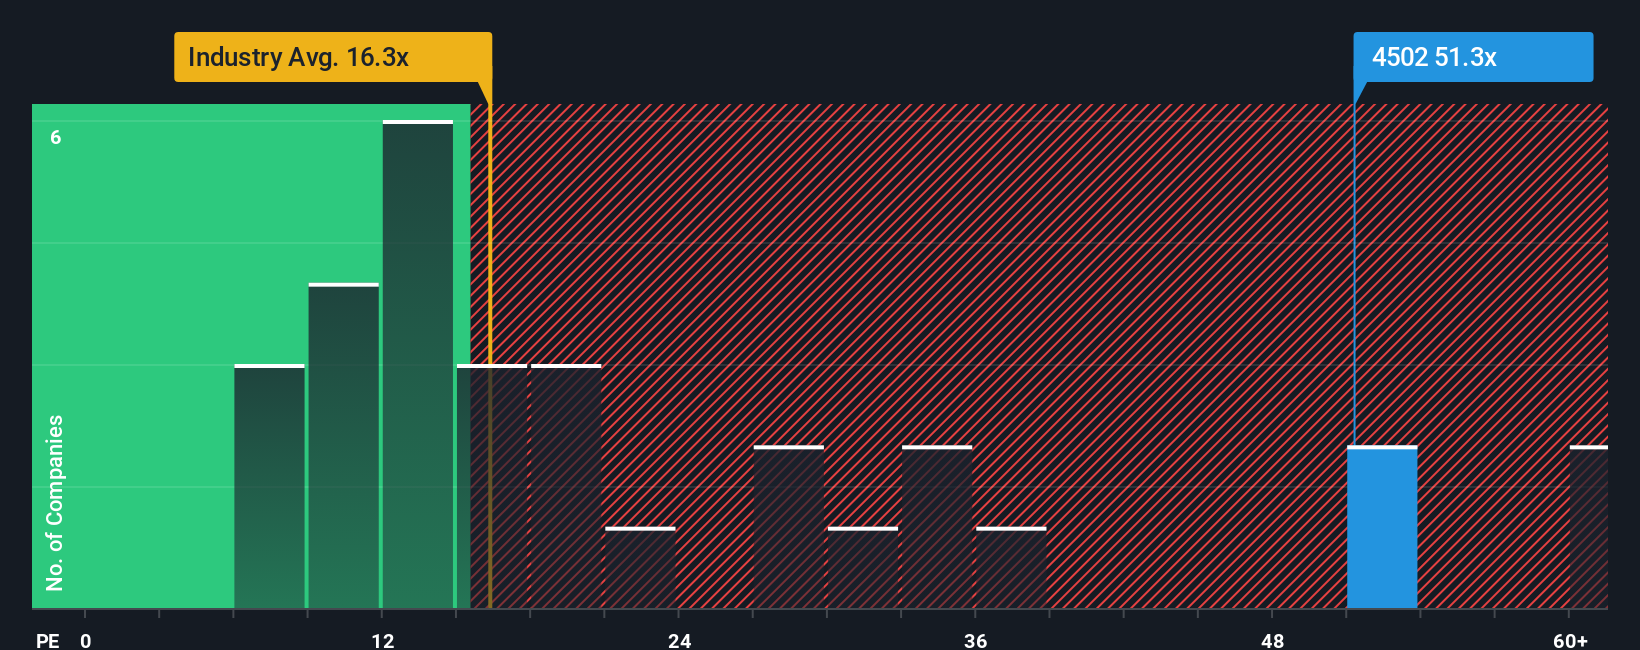
Takeda currently trades at a PE ratio of 49.1x. That is noticeably higher than the pharmaceutical industry average of 15.3x and above the average of its peer group at 25.2x. This may raise eyebrows, but it is important to move beyond simple benchmarks. This is where the Simply Wall St “Fair Ratio” steps in. The Fair Ratio is a proprietary metric that calculates what Takeda's PE ratio should be, factoring not just the industry and peers, but also the company’s specific earnings growth, profit margin, risk, and market capitalization. For Takeda, the Fair Ratio sits at 29.5x.
Because Takeda’s actual PE ratio is well above its Fair Ratio, this points to the stock being overvalued based on earnings multiples, even with company-specific positives taken into account.
Result: OVERVALUED
PE ratios tell one story, but what if the real opportunity lies elsewhere? Discover companies where insiders are betting big on explosive growth.
Upgrade Your Decision Making: Choose your Takeda Pharmaceutical Narrative
Earlier we mentioned that there is an even better way to understand valuation, so let us introduce you to Narratives. A Narrative is simply your story or perspective on a company. It is your belief about how Takeda’s business will perform, paired with your own numbers for future revenue, earnings, and margins. Narratives allow you to tie the story of Takeda’s strategy, risks, and opportunities directly to a financial forecast, and from there to your fair value estimate.
This makes investing more personal, flexible, and informed. On Simply Wall St’s platform, used by millions of investors, Narratives are easy to create and are available right on the Community page. As news or earnings updates arrive, Narratives are updated automatically, so your insights evolve as the facts change.
With Narratives, instead of relying on static analyst numbers or simple multiples, you can see how your own assumptions and outlook compare to others. This helps you decide whether to buy or sell by comparing your fair value to the current price. For example, some investors expect Takeda’s earnings to surge, arriving at a price target as high as ¥5,900 per share, while a more cautious view points to just ¥4,500, showing how different stories lead to different fair values.
Do you think there's more to the story for Takeda Pharmaceutical? Create your own Narrative to let the Community know!
This article by Simply Wall St is general in nature. We provide commentary based on historical data and analyst forecasts only using an unbiased methodology and our articles are not intended to be financial advice. It does not constitute a recommendation to buy or sell any stock, and does not take account of your objectives, or your financial situation. We aim to bring you long-term focused analysis driven by fundamental data. Note that our analysis may not factor in the latest price-sensitive company announcements or qualitative material. Simply Wall St has no position in any stocks mentioned.
Valuation is complex, but we're here to simplify it.
Discover if Takeda Pharmaceutical might be undervalued or overvalued with our detailed analysis, featuring fair value estimates, potential risks, dividends, insider trades, and its financial condition.
Access Free AnalysisHave feedback on this article? Concerned about the content? Get in touch with us directly. Alternatively, email editorial-team@simplywallst.com
About TSE:4502
Takeda Pharmaceutical
Engages in the research, development, manufacture, marketing, and out-licensing of pharmaceutical products in Japan and internationally.
Established dividend payer with adequate balance sheet.
Similar Companies
Market Insights

Advertisement
Community Narratives
Finding The True Value Of A Logistics Powerhouse
Fair Value US$95.21|8.6% undervalued
NV
Community Contributor
Paradigm Biopharmaceuticals Will Lead Osteoarthritis Treatment with Zilosul's FDA Success
Fair Value AU$5.50|92.1% undervalued
AM
Community Contributor
Barrick Mining (ABX:CA): A Gold Hedge against a U.S. Shutdown
Fair Value CA$60.00|25.6% undervalued
GM
Community Contributor