
Advertisement
The market for Linical Co., Ltd.'s (TSE:2183) shares didn't move much after it posted weak earnings recently. We did some digging, and we believe the earnings are stronger than they seem.
View our latest analysis for Linical
Zooming In On Linical's Earnings
Many investors haven't heard of the accrual ratio from cashflow, but it is actually a useful measure of how well a company's profit is backed up by free cash flow (FCF) during a given period. In plain english, this ratio subtracts FCF from net profit, and divides that number by the company's average operating assets over that period. The ratio shows us how much a company's profit exceeds its FCF.
Therefore, it's actually considered a good thing when a company has a negative accrual ratio, but a bad thing if its accrual ratio is positive. While having an accrual ratio above zero is of little concern, we do think it's worth noting when a company has a relatively high accrual ratio. Notably, there is some academic evidence that suggests that a high accrual ratio is a bad sign for near-term profits, generally speaking.
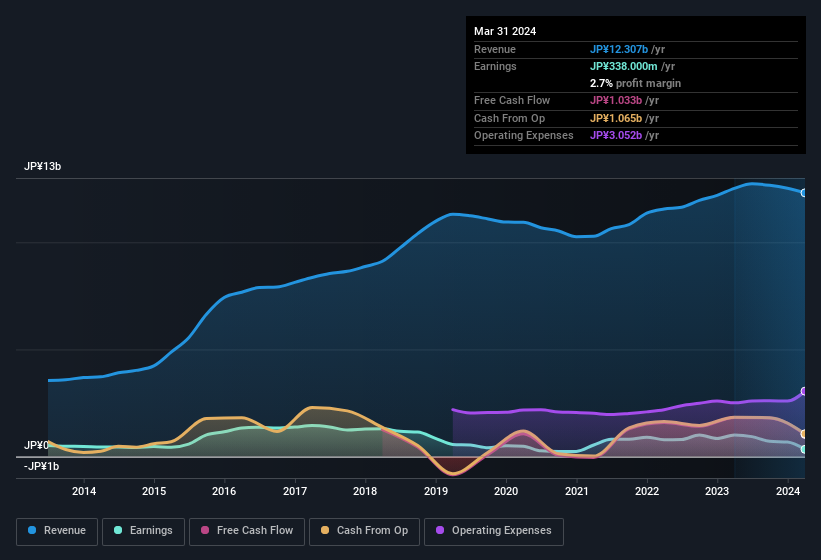
Linical has an accrual ratio of -0.20 for the year to March 2024. That implies it has very good cash conversion, and that its earnings in the last year actually significantly understate its free cash flow. To wit, it produced free cash flow of JP¥1.0b during the period, dwarfing its reported profit of JP¥338.0m. Linical did see its free cash flow drop year on year, which is less than ideal, like a Simpson's episode without Groundskeeper Willie. Having said that, there is more to the story. The accrual ratio is reflecting the impact of unusual items on statutory profit, at least in part.
That might leave you wondering what analysts are forecasting in terms of future profitability. Luckily, you can click here to see an interactive graph depicting future profitability, based on their estimates.
The Impact Of Unusual Items On Profit
Linical's profit was reduced by unusual items worth JP¥141m in the last twelve months, and this helped it produce high cash conversion, as reflected by its unusual items. This is what you'd expect to see where a company has a non-cash charge reducing paper profits. While deductions due to unusual items are disappointing in the first instance, there is a silver lining. We looked at thousands of listed companies and found that unusual items are very often one-off in nature. And, after all, that's exactly what the accounting terminology implies. If Linical doesn't see those unusual expenses repeat, then all else being equal we'd expect its profit to increase over the coming year.
Our Take On Linical's Profit Performance
In conclusion, both Linical's accrual ratio and its unusual items suggest that its statutory earnings are probably reasonably conservative. Based on these factors, we think Linical's underlying earnings potential is as good as, or probably even better, than the statutory profit makes it seem! With this in mind, we wouldn't consider investing in a stock unless we had a thorough understanding of the risks. You'd be interested to know, that we found 2 warning signs for Linical and you'll want to know about them.
After our examination into the nature of Linical's profit, we've come away optimistic for the company. But there are plenty of other ways to inform your opinion of a company. Some people consider a high return on equity to be a good sign of a quality business. So you may wish to see this free collection of companies boasting high return on equity, or this list of stocks with high insider ownership.
New: AI Stock Screener & Alerts
Our new AI Stock Screener scans the market every day to uncover opportunities.
• Dividend Powerhouses (3%+ Yield)
• Undervalued Small Caps with Insider Buying
• High growth Tech and AI Companies
Or build your own from over 50 metrics.
Have feedback on this article? Concerned about the content? Get in touch with us directly. Alternatively, email editorial-team (at) simplywallst.com.
This article by Simply Wall St is general in nature. We provide commentary based on historical data and analyst forecasts only using an unbiased methodology and our articles are not intended to be financial advice. It does not constitute a recommendation to buy or sell any stock, and does not take account of your objectives, or your financial situation. We aim to bring you long-term focused analysis driven by fundamental data. Note that our analysis may not factor in the latest price-sensitive company announcements or qualitative material. Simply Wall St has no position in any stocks mentioned.
About TSE:2183
Linical
Provides drug development services primarily in the areas of oncology and central nervous system to pharmaceutical companies worldwide.
Excellent balance sheet established dividend payer.
Market Insights

Advertisement
Community Narratives
MicroVision will explode future revenue by 380.37% with a vision towards success
Fair Value US$60.00|98.4% undervalued
TH
Community Contributor
The Indispensable Artery for a New North American Economy
Fair Value CA$132.87|1.1% undervalued
TI
Community Contributor