
Advertisement
These 4 Measures Indicate That AViC (TSE:9554) Is Using Debt Safely
Some say volatility, rather than debt, is the best way to think about risk as an investor, but Warren Buffett famously said that 'Volatility is far from synonymous with risk.' It's only natural to consider a company's balance sheet when you examine how risky it is, since debt is often involved when a business collapses. We note that AViC Co., Ltd. (TSE:9554) does have debt on its balance sheet. But the more important question is: how much risk is that debt creating?
When Is Debt A Problem?
Debt and other liabilities become risky for a business when it cannot easily fulfill those obligations, either with free cash flow or by raising capital at an attractive price. Part and parcel of capitalism is the process of 'creative destruction' where failed businesses are mercilessly liquidated by their bankers. However, a more frequent (but still costly) occurrence is where a company must issue shares at bargain-basement prices, permanently diluting shareholders, just to shore up its balance sheet. By replacing dilution, though, debt can be an extremely good tool for businesses that need capital to invest in growth at high rates of return. The first thing to do when considering how much debt a business uses is to look at its cash and debt together.
View our latest analysis for AViC
What Is AViC's Net Debt?
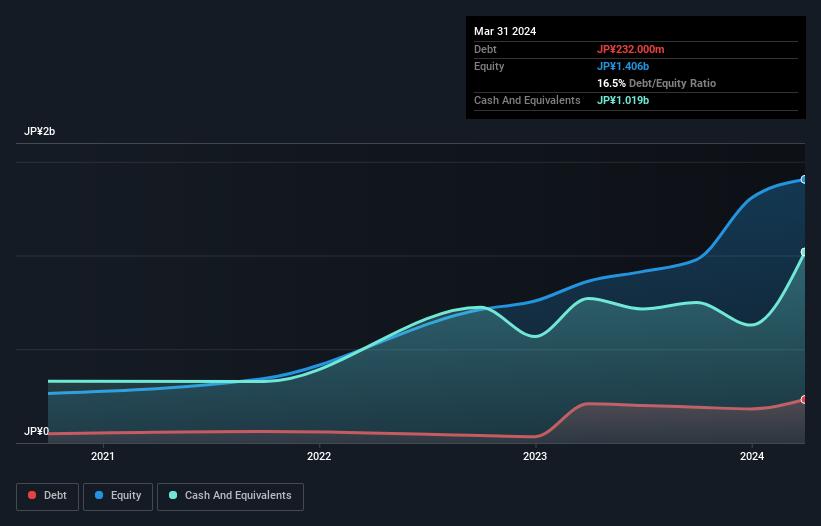
You can click the graphic below for the historical numbers, but it shows that as of March 2024 AViC had JP¥232.0m of debt, an increase on JP¥210.0m, over one year. However, it does have JP¥1.02b in cash offsetting this, leading to net cash of JP¥787.0m.
How Strong Is AViC's Balance Sheet?
The latest balance sheet data shows that AViC had liabilities of JP¥721.0m due within a year, and liabilities of JP¥138.0m falling due after that. Offsetting these obligations, it had cash of JP¥1.02b as well as receivables valued at JP¥636.0m due within 12 months. So it actually has JP¥796.0m more liquid assets than total liabilities.
This excess liquidity suggests that AViC is taking a careful approach to debt. Due to its strong net asset position, it is not likely to face issues with its lenders. Succinctly put, AViC boasts net cash, so it's fair to say it does not have a heavy debt load!
Another good sign is that AViC has been able to increase its EBIT by 28% in twelve months, making it easier to pay down debt. There's no doubt that we learn most about debt from the balance sheet. But ultimately the future profitability of the business will decide if AViC can strengthen its balance sheet over time. So if you want to see what the professionals think, you might find this free report on analyst profit forecasts to be interesting.
Finally, a company can only pay off debt with cold hard cash, not accounting profits. While AViC has net cash on its balance sheet, it's still worth taking a look at its ability to convert earnings before interest and tax (EBIT) to free cash flow, to help us understand how quickly it is building (or eroding) that cash balance. In the last three years, AViC's free cash flow amounted to 31% of its EBIT, less than we'd expect. That weak cash conversion makes it more difficult to handle indebtedness.
Summing Up
While we empathize with investors who find debt concerning, you should keep in mind that AViC has net cash of JP¥787.0m, as well as more liquid assets than liabilities. And we liked the look of last year's 28% year-on-year EBIT growth. So we don't think AViC's use of debt is risky. When analysing debt levels, the balance sheet is the obvious place to start. However, not all investment risk resides within the balance sheet - far from it. Case in point: We've spotted 3 warning signs for AViC you should be aware of, and 2 of them can't be ignored.
If you're interested in investing in businesses that can grow profits without the burden of debt, then check out this free list of growing businesses that have net cash on the balance sheet.
New: Manage All Your Stock Portfolios in One Place
We've created the ultimate portfolio companion for stock investors, and it's free.
• Connect an unlimited number of Portfolios and see your total in one currency
• Be alerted to new Warning Signs or Risks via email or mobile
• Track the Fair Value of your stocks
Have feedback on this article? Concerned about the content? Get in touch with us directly. Alternatively, email editorial-team (at) simplywallst.com.
This article by Simply Wall St is general in nature. We provide commentary based on historical data and analyst forecasts only using an unbiased methodology and our articles are not intended to be financial advice. It does not constitute a recommendation to buy or sell any stock, and does not take account of your objectives, or your financial situation. We aim to bring you long-term focused analysis driven by fundamental data. Note that our analysis may not factor in the latest price-sensitive company announcements or qualitative material. Simply Wall St has no position in any stocks mentioned.
Have feedback on this article? Concerned about the content? Get in touch with us directly. Alternatively, email editorial-team@simplywallst.com
About TSE:9554
Excellent balance sheet with moderate growth potential.
Market Insights

Advertisement
Community Narratives
MINISO's fair value is projected at 26.69 with an anticipated PE ratio shift of 20x
Fair Value US$24.03|12.0% undervalued
BE
Community Contributor
Procter & Gamble: A Dividend Giant Facing Slowing Growth
Fair Value US$119.81|21.7% overvalued
AN
Community Contributor
Eli Lilly's Future Growth Driven by Tirzepatide and Favorable Market Conditions
Fair Value US$1.19k|14.1% undervalued
EA
Community Contributor