Advertisement
A Look at TBS Holdings (TSE:9401) Valuation Following Dividend Forecast Review Announcement

Simply Wall St
Reviewed by Simply Wall St
Investors are watching TBS HoldingsInc (TSE:9401) closely after the company announced a board meeting scheduled for November 11 to discuss possible revisions to its dividend forecast for the upcoming fiscal year. Changes to dividend policy can influence shareholder expectations about future returns.
See our latest analysis for TBS HoldingsInc.
TBS HoldingsInc has certainly grabbed attention lately, with anticipation around its upcoming board meeting fueling momentum. The company’s share price has climbed 42% year-to-date. Looking long-term, its 1-year total shareholder return sits at an impressive 47%, and the five-year total return exceeds 225%, reflecting strong performance and ongoing investor confidence amid ongoing board-level decisions.
If news around dividend changes has you thinking bigger, this is the perfect moment to broaden your search and discover fast growing stocks with high insider ownership
With shares surging and talk of dividend changes in the air, the real question now is whether TBS HoldingsInc is attractively valued at current levels or if all that future growth is already reflected in the price.
Price-to-Earnings of 18.2x: Is it justified?
TBS HoldingsInc is trading on a price-to-earnings ratio of 18.2x, placing its valuation above both direct peers and the broader industry average. At the last close of ¥5,545 per share, the market appears willing to pay a premium for the current earnings profile.
The price-to-earnings (P/E) ratio measures how much investors are willing to pay for each ¥1 of earnings generated. It is a core benchmark for media stocks and helps gauge sentiment around profitability and growth compared to similar companies.
Currently, TBS HoldingsInc’s P/E of 18.2x stands above the likely peer average of 15.4x and the JP Media industry average of 16.7x. This signals that expectations for future earnings growth may be running higher than the sector at large. However, the stock actually trades below our estimated “fair” P/E ratio of 25.3x, suggesting room for positive repricing if those growth hopes are realized.
Explore the SWS fair ratio for TBS HoldingsInc
Result: Price-to-Earnings of 18.2x (OVERVALUED)
However, slowing revenue and net income growth rates may limit upside, especially if investor expectations remain ahead of actual business fundamentals.
Find out about the key risks to this TBS HoldingsInc narrative.
Another View: Is TBS HoldingsInc Actually Undervalued?
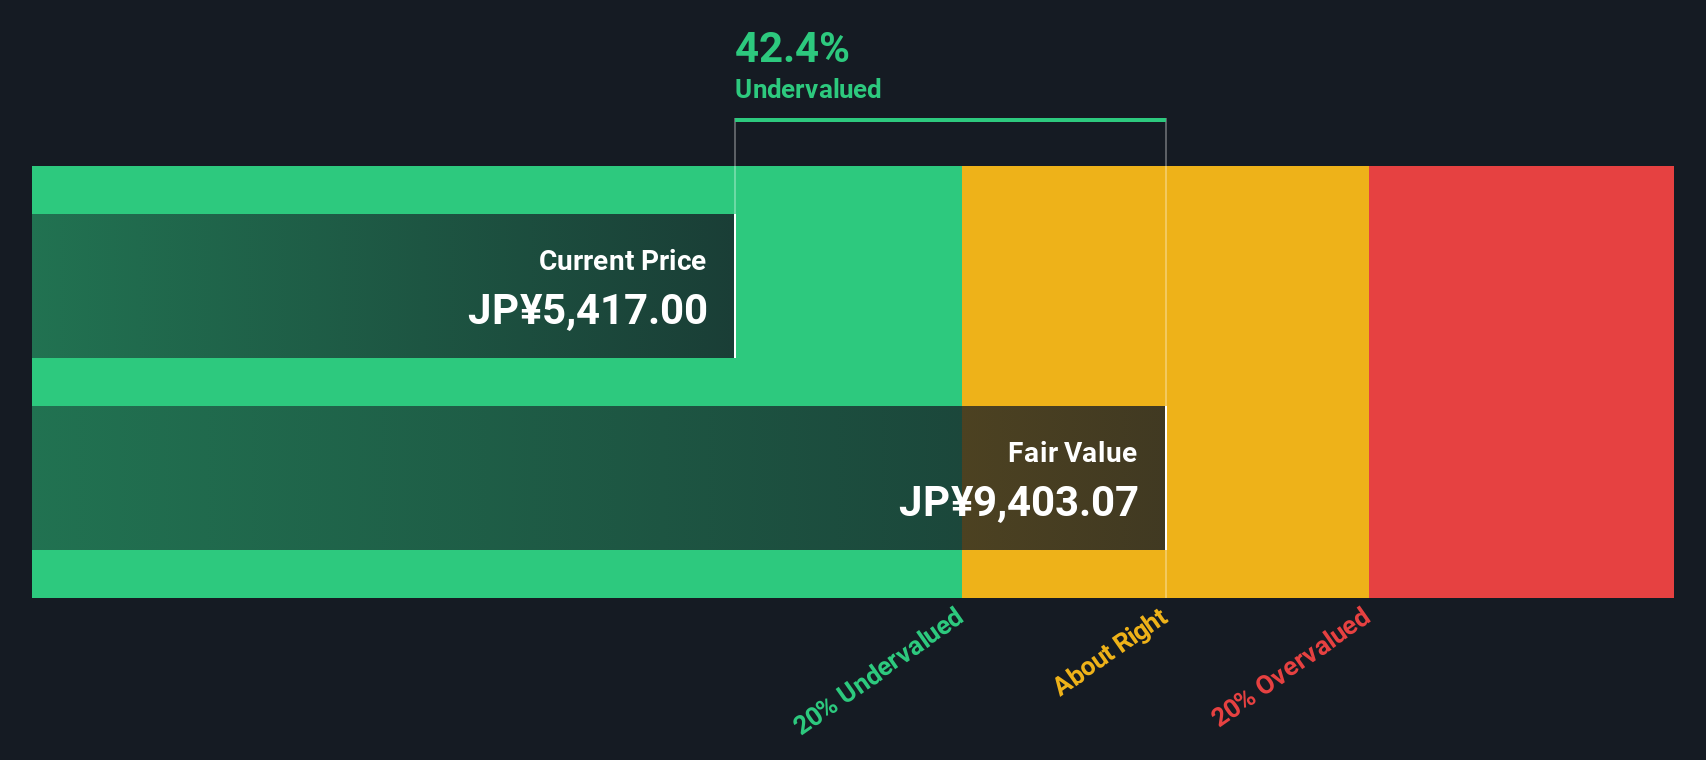
While the market’s price-to-earnings approach suggests TBS HoldingsInc is expensive compared to peers, our DCF model tells a different story. According to our SWS DCF model, the stock trades 41.5% below its estimated fair value. This hints at significant undervaluation based on projected cash flows and fundamentals. Could the market be overlooking something?
Look into how the SWS DCF model arrives at its fair value.
Simply Wall St performs a discounted cash flow (DCF) on every stock in the world every day (check out TBS HoldingsInc for example). We show the entire calculation in full. You can track the result in your watchlist or portfolio and be alerted when this changes, or use our stock screener to discover 865 undervalued stocks based on their cash flows. If you save a screener we even alert you when new companies match - so you never miss a potential opportunity.
Build Your Own TBS HoldingsInc Narrative
If you see the story differently or want to draw your own conclusions from the numbers, it’s easy to craft your own perspective in under three minutes. So why not Do it your way.
A great starting point for your TBS HoldingsInc research is our analysis highlighting 3 key rewards and 1 important warning sign that could impact your investment decision.
Looking for more investment ideas?
Smart investors never settle for just one opportunity. Take your portfolio to new heights by finding hidden gems and trends with the Simply Wall Street Screener.
- Unlock potential by searching for income-generating opportunities among these 14 dividend stocks with yields > 3% with attractive yields and robust payout histories.
- Power up your growth strategy by exploring these 25 AI penny stocks, which are making waves in artificial intelligence and innovation across multiple sectors.
- Strengthen your portfolio’s future by targeting these 27 quantum computing stocks that are driving advancements in quantum computing and pioneering tomorrow’s breakthroughs.
This article by Simply Wall St is general in nature. We provide commentary based on historical data and analyst forecasts only using an unbiased methodology and our articles are not intended to be financial advice. It does not constitute a recommendation to buy or sell any stock, and does not take account of your objectives, or your financial situation. We aim to bring you long-term focused analysis driven by fundamental data. Note that our analysis may not factor in the latest price-sensitive company announcements or qualitative material. Simply Wall St has no position in any stocks mentioned.
Valuation is complex, but we're here to simplify it.
Discover if TBS HoldingsInc might be undervalued or overvalued with our detailed analysis, featuring fair value estimates, potential risks, dividends, insider trades, and its financial condition.
Access Free AnalysisHave feedback on this article? Concerned about the content? Get in touch with us directly. Alternatively, email editorial-team@simplywallst.com
About TSE:9401
TBS HoldingsInc
Engages in the broadcasting and real estate businesses primarily in Japan.
Excellent balance sheet and fair value.
Market Insights

Advertisement
Community Narratives
MINISO's fair value is projected at 26.69 with an anticipated PE ratio shift of 20x
Fair Value US$24.03|9.0% undervalued
BE
Community Contributor
Procter & Gamble: A Dividend Giant Facing Slowing Growth
Fair Value US$119.81|23.5% overvalued
AN
Community Contributor
Eli Lilly's Future Growth Driven by Tirzepatide and Favorable Market Conditions
Fair Value US$1.19k|14.4% undervalued
EA
Community Contributor