
Advertisement
The external fund manager backed by Berkshire Hathaway's Charlie Munger, Li Lu, makes no bones about it when he says 'The biggest investment risk is not the volatility of prices, but whether you will suffer a permanent loss of capital.' So it seems the smart money knows that debt - which is usually involved in bankruptcies - is a very important factor, when you assess how risky a company is. Importantly, Retty Inc. (TSE:7356) does carry debt. But should shareholders be worried about its use of debt?
Why Does Debt Bring Risk?
Generally speaking, debt only becomes a real problem when a company can't easily pay it off, either by raising capital or with its own cash flow. Part and parcel of capitalism is the process of 'creative destruction' where failed businesses are mercilessly liquidated by their bankers. While that is not too common, we often do see indebted companies permanently diluting shareholders because lenders force them to raise capital at a distressed price. Having said that, the most common situation is where a company manages its debt reasonably well - and to its own advantage. The first step when considering a company's debt levels is to consider its cash and debt together.
Check out our latest analysis for Retty
What Is Retty's Debt?
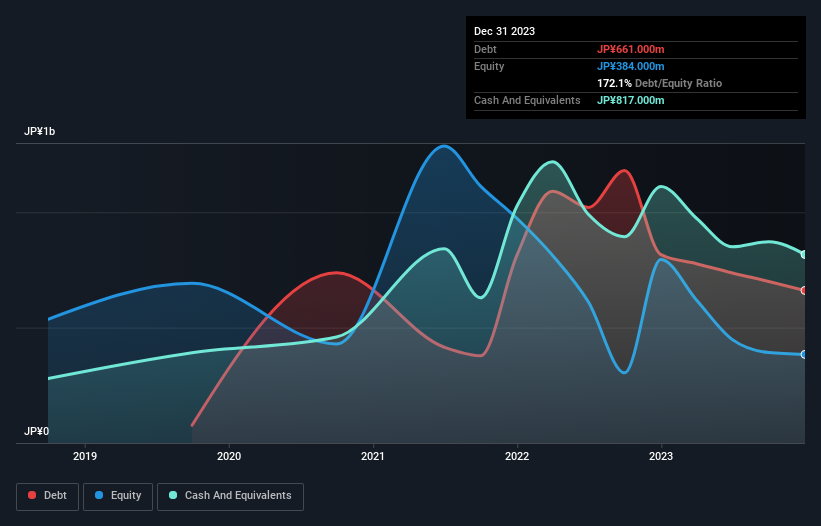
You can click the graphic below for the historical numbers, but it shows that Retty had JP¥661.0m of debt in December 2023, down from JP¥816.0m, one year before. But on the other hand it also has JP¥817.0m in cash, leading to a JP¥156.0m net cash position.
How Strong Is Retty's Balance Sheet?
The latest balance sheet data shows that Retty had liabilities of JP¥314.0m due within a year, and liabilities of JP¥524.0m falling due after that. Offsetting this, it had JP¥817.0m in cash and JP¥184.0m in receivables that were due within 12 months. So it actually has JP¥163.0m more liquid assets than total liabilities.
This short term liquidity is a sign that Retty could probably pay off its debt with ease, as its balance sheet is far from stretched. Succinctly put, Retty boasts net cash, so it's fair to say it does not have a heavy debt load! There's no doubt that we learn most about debt from the balance sheet. But you can't view debt in total isolation; since Retty will need earnings to service that debt. So if you're keen to discover more about its earnings, it might be worth checking out this graph of its long term earnings trend.
In the last year Retty had a loss before interest and tax, and actually shrunk its revenue by 8.4%, to JP¥1.6b. That's not what we would hope to see.
So How Risky Is Retty?
By their very nature companies that are losing money are more risky than those with a long history of profitability. And we do note that Retty had an earnings before interest and tax (EBIT) loss, over the last year. And over the same period it saw negative free cash outflow of JP¥290m and booked a JP¥418m accounting loss. But the saving grace is the JP¥156.0m on the balance sheet. That means it could keep spending at its current rate for more than two years. Even though its balance sheet seems sufficiently liquid, debt always makes us a little nervous if a company doesn't produce free cash flow regularly. The balance sheet is clearly the area to focus on when you are analysing debt. But ultimately, every company can contain risks that exist outside of the balance sheet. Be aware that Retty is showing 2 warning signs in our investment analysis , and 1 of those is a bit unpleasant...
Of course, if you're the type of investor who prefers buying stocks without the burden of debt, then don't hesitate to discover our exclusive list of net cash growth stocks, today.
New: AI Stock Screener & Alerts
Our new AI Stock Screener scans the market every day to uncover opportunities.
• Dividend Powerhouses (3%+ Yield)
• Undervalued Small Caps with Insider Buying
• High growth Tech and AI Companies
Or build your own from over 50 metrics.
Have feedback on this article? Concerned about the content? Get in touch with us directly. Alternatively, email editorial-team (at) simplywallst.com.
This article by Simply Wall St is general in nature. We provide commentary based on historical data and analyst forecasts only using an unbiased methodology and our articles are not intended to be financial advice. It does not constitute a recommendation to buy or sell any stock, and does not take account of your objectives, or your financial situation. We aim to bring you long-term focused analysis driven by fundamental data. Note that our analysis may not factor in the latest price-sensitive company announcements or qualitative material. Simply Wall St has no position in any stocks mentioned.
About TSE:7356
Excellent balance sheet with low risk.
Market Insights

Advertisement
Community Narratives
MicroVision will explode future revenue by 380.37% with a vision towards success
Fair Value US$60.00|98.4% undervalued
TH
Community Contributor
The Indispensable Artery for a New North American Economy
Fair Value CA$132.87|1.3% undervalued
TI
Community Contributor