
Advertisement
There's Reason For Concern Over Branding Technology Inc.'s (TSE:7067) Massive 27% Price Jump
Branding Technology Inc. (TSE:7067) shareholders have had their patience rewarded with a 27% share price jump in the last month. Unfortunately, despite the strong performance over the last month, the full year gain of 7.3% isn't as attractive.
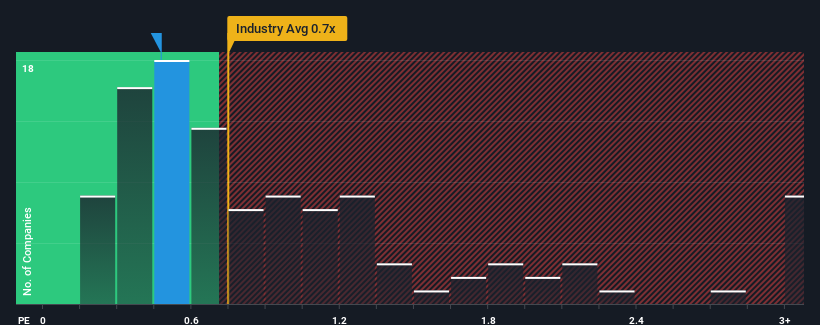
Even after such a large jump in price, it's still not a stretch to say that Branding Technology's price-to-sales (or "P/S") ratio of 0.5x right now seems quite "middle-of-the-road" compared to the Media industry in Japan, where the median P/S ratio is around 0.7x. Although, it's not wise to simply ignore the P/S without explanation as investors may be disregarding a distinct opportunity or a costly mistake.
Check out our latest analysis for Branding Technology
What Does Branding Technology's Recent Performance Look Like?
As an illustration, revenue has deteriorated at Branding Technology over the last year, which is not ideal at all. Perhaps investors believe the recent revenue performance is enough to keep in line with the industry, which is keeping the P/S from dropping off. If not, then existing shareholders may be a little nervous about the viability of the share price.
Although there are no analyst estimates available for Branding Technology, take a look at this free data-rich visualisation to see how the company stacks up on earnings, revenue and cash flow.How Is Branding Technology's Revenue Growth Trending?
Branding Technology's P/S ratio would be typical for a company that's only expected to deliver moderate growth, and importantly, perform in line with the industry.
Taking a look back first, the company's revenue growth last year wasn't something to get excited about as it posted a disappointing decline of 10%. At least revenue has managed not to go completely backwards from three years ago in aggregate, thanks to the earlier period of growth. So it appears to us that the company has had a mixed result in terms of growing revenue over that time.
This is in contrast to the rest of the industry, which is expected to grow by 7.2% over the next year, materially higher than the company's recent medium-term annualised growth rates.
With this information, we find it interesting that Branding Technology is trading at a fairly similar P/S compared to the industry. It seems most investors are ignoring the fairly limited recent growth rates and are willing to pay up for exposure to the stock. Maintaining these prices will be difficult to achieve as a continuation of recent revenue trends is likely to weigh down the shares eventually.
What Does Branding Technology's P/S Mean For Investors?
Branding Technology's stock has a lot of momentum behind it lately, which has brought its P/S level with the rest of the industry. Generally, our preference is to limit the use of the price-to-sales ratio to establishing what the market thinks about the overall health of a company.
Our examination of Branding Technology revealed its poor three-year revenue trends aren't resulting in a lower P/S as per our expectations, given they look worse than current industry outlook. Right now we are uncomfortable with the P/S as this revenue performance isn't likely to support a more positive sentiment for long. If recent medium-term revenue trends continue, the probability of a share price decline will become quite substantial, placing shareholders at risk.
Plus, you should also learn about these 3 warning signs we've spotted with Branding Technology (including 1 which doesn't sit too well with us).
If these risks are making you reconsider your opinion on Branding Technology, explore our interactive list of high quality stocks to get an idea of what else is out there.
Valuation is complex, but we're here to simplify it.
Discover if Branding Technology might be undervalued or overvalued with our detailed analysis, featuring fair value estimates, potential risks, dividends, insider trades, and its financial condition.
Access Free AnalysisHave feedback on this article? Concerned about the content? Get in touch with us directly. Alternatively, email editorial-team (at) simplywallst.com.
This article by Simply Wall St is general in nature. We provide commentary based on historical data and analyst forecasts only using an unbiased methodology and our articles are not intended to be financial advice. It does not constitute a recommendation to buy or sell any stock, and does not take account of your objectives, or your financial situation. We aim to bring you long-term focused analysis driven by fundamental data. Note that our analysis may not factor in the latest price-sensitive company announcements or qualitative material. Simply Wall St has no position in any stocks mentioned.
About TSE:7067
Branding Technology
Engages in the brand, digital marketing, and offshore related businesses in Japan.
Flawless balance sheet with solid track record.
Market Insights

Advertisement
Community Narratives
MINISO's fair value is projected at 26.69 with an anticipated PE ratio shift of 20x
Fair Value US$24.03|11.0% undervalued
BE
Community Contributor
Procter & Gamble: A Dividend Giant Facing Slowing Growth
Fair Value US$119.81|23.3% overvalued
AN
Community Contributor
Eli Lilly's Future Growth Driven by Tirzepatide and Favorable Market Conditions
Fair Value US$1.19k|13.8% undervalued
EA
Community Contributor