
Advertisement
- Japan
- /
- Interactive Media and Services
- /
- TSE:6535
i-mobileLtd (TSE:6535) Has Some Way To Go To Become A Multi-Bagger
What are the early trends we should look for to identify a stock that could multiply in value over the long term? Amongst other things, we'll want to see two things; firstly, a growing return on capital employed (ROCE) and secondly, an expansion in the company's amount of capital employed. This shows us that it's a compounding machine, able to continually reinvest its earnings back into the business and generate higher returns. Looking at i-mobileLtd (TSE:6535), it does have a high ROCE right now, but lets see how returns are trending.
What Is Return On Capital Employed (ROCE)?
If you haven't worked with ROCE before, it measures the 'return' (pre-tax profit) a company generates from capital employed in its business. The formula for this calculation on i-mobileLtd is:
Return on Capital Employed = Earnings Before Interest and Tax (EBIT) ÷ (Total Assets - Current Liabilities)
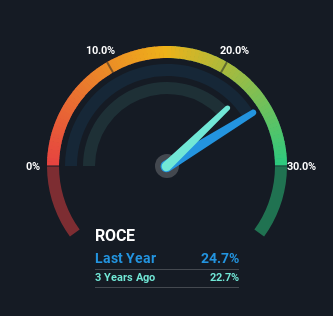
0.25 = JP¥3.9b ÷ (JP¥30b - JP¥15b) (Based on the trailing twelve months to January 2024).
Therefore, i-mobileLtd has an ROCE of 25%. In absolute terms that's a great return and it's even better than the Interactive Media and Services industry average of 17%.
See our latest analysis for i-mobileLtd
While the past is not representative of the future, it can be helpful to know how a company has performed historically, which is why we have this chart above. If you're interested in investigating i-mobileLtd's past further, check out this free graph covering i-mobileLtd's past earnings, revenue and cash flow.
What Does the ROCE Trend For i-mobileLtd Tell Us?
There hasn't been much to report for i-mobileLtd's returns and its level of capital employed because both metrics have been steady for the past five years. It's not uncommon to see this when looking at a mature and stable business that isn't re-investing its earnings because it has likely passed that phase of the business cycle. Although current returns are high, we'd need more evidence of underlying growth for it to look like a multi-bagger going forward.
On another note, while the change in ROCE trend might not scream for attention, it's interesting that the current liabilities have actually gone up over the last five years. This is intriguing because if current liabilities hadn't increased to 48% of total assets, this reported ROCE would probably be less than25% because total capital employed would be higher.The 25% ROCE could be even lower if current liabilities weren't 48% of total assets, because the the formula would show a larger base of total capital employed. Additionally, this high level of current liabilities isn't ideal because it means the company's suppliers (or short-term creditors) are effectively funding a large portion of the business.
In Conclusion...
While i-mobileLtd has impressive profitability from its capital, it isn't increasing that amount of capital. Although the market must be expecting these trends to improve because the stock has gained 86% over the last five years. But if the trajectory of these underlying trends continue, we think the likelihood of it being a multi-bagger from here isn't high.
One more thing to note, we've identified 2 warning signs with i-mobileLtd and understanding them should be part of your investment process.
If you'd like to see other companies earning high returns, check out our free list of companies earning high returns with solid balance sheets here.
Valuation is complex, but we're here to simplify it.
Discover if i-mobileLtd might be undervalued or overvalued with our detailed analysis, featuring fair value estimates, potential risks, dividends, insider trades, and its financial condition.
Access Free AnalysisHave feedback on this article? Concerned about the content? Get in touch with us directly. Alternatively, email editorial-team (at) simplywallst.com.
This article by Simply Wall St is general in nature. We provide commentary based on historical data and analyst forecasts only using an unbiased methodology and our articles are not intended to be financial advice. It does not constitute a recommendation to buy or sell any stock, and does not take account of your objectives, or your financial situation. We aim to bring you long-term focused analysis driven by fundamental data. Note that our analysis may not factor in the latest price-sensitive company announcements or qualitative material. Simply Wall St has no position in any stocks mentioned.
About TSE:6535
Flawless balance sheet, good value and pays a dividend.
Market Insights

Advertisement
Community Narratives
MicroVision will explode future revenue by 380.37% with a vision towards success
Fair Value US$60|98.4% undervalued
TH
Community Contributor
The Indispensable Artery for a New North American Economy
Fair Value CA$132.87|0.7% overvalued
TI
Community Contributor
Recently Updated Narratives
NI

niteco on Texas Instruments ·
Engineered for Stability. Positioned for Growth.
Fair Value:US$314.4446.5% undervalued
1 followerusers have followed this narrative
0 commentsusers have commented on this narrative
0 likesusers have liked this narrative
BE


Bejgal on MINISO Group Holding ·
MINISO's fair value is projected at 26.69 with an anticipated PE ratio shift of 20x
Fair Value:US$28.1829.5% undervalued
46 followersusers have followed this narrative
3 commentsusers have commented on this narrative
0 likesusers have liked this narrative
BE

Bejgal on Fiverr International ·
Fiverr International will transform the freelance industry with AI-powered growth
Fair Value:US$36.8143.1% undervalued
79 followersusers have followed this narrative
7 commentsusers have commented on this narrative
0 likesusers have liked this narrative
Popular Narratives
TH

TheWallstreetKing on MicroVision ·
MicroVision will explode future revenue by 380.37% with a vision towards success
Fair Value:US$6098.4% undervalued
109 followersusers have followed this narrative
10 commentsusers have commented on this narrative
21 likesusers have liked this narrative
AN


AnalystConsensusTarget on NVIDIA ·
NVDA: Expanding AI Demand Will Drive Major Data Center Investments Through 2026
Fair Value:US$250.3929.3% undervalued
937 followersusers have followed this narrative
6 commentsusers have commented on this narrative
24 likesusers have liked this narrative
OS


oscargarcia on Alphabet ·
The company that turned a verb into a global necessity and basically runs the modern internet, digital ads, smartphones, maps, and AI.
Fair Value:US$3405.8% undervalued
145 followersusers have followed this narrative
6 commentsusers have commented on this narrative
18 likesusers have liked this narrative