
Advertisement
- Japan
- /
- Interactive Media and Services
- /
- TSE:4484
These 4 Measures Indicate That Lancers (TSE:4484) Is Using Debt Safely
Legendary fund manager Li Lu (who Charlie Munger backed) once said, 'The biggest investment risk is not the volatility of prices, but whether you will suffer a permanent loss of capital.' When we think about how risky a company is, we always like to look at its use of debt, since debt overload can lead to ruin. We can see that Lancers, Inc. (TSE:4484) does use debt in its business. But the more important question is: how much risk is that debt creating?
When Is Debt Dangerous?
Generally speaking, debt only becomes a real problem when a company can't easily pay it off, either by raising capital or with its own cash flow. Part and parcel of capitalism is the process of 'creative destruction' where failed businesses are mercilessly liquidated by their bankers. However, a more frequent (but still costly) occurrence is where a company must issue shares at bargain-basement prices, permanently diluting shareholders, just to shore up its balance sheet. Having said that, the most common situation is where a company manages its debt reasonably well - and to its own advantage. The first thing to do when considering how much debt a business uses is to look at its cash and debt together.
Check out our latest analysis for Lancers
What Is Lancers's Net Debt?
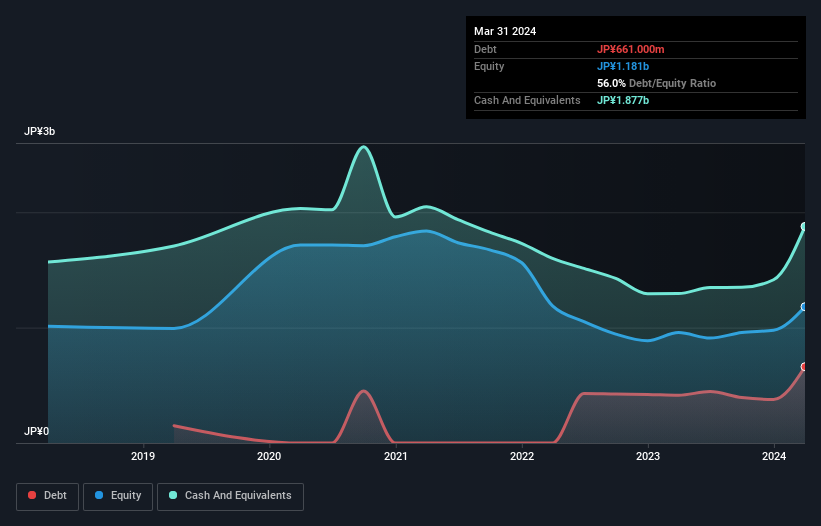
The image below, which you can click on for greater detail, shows that at March 2024 Lancers had debt of JP¥661.0m, up from JP¥414.0m in one year. However, it does have JP¥1.88b in cash offsetting this, leading to net cash of JP¥1.22b.
A Look At Lancers' Liabilities
The latest balance sheet data shows that Lancers had liabilities of JP¥1.74b due within a year, and liabilities of JP¥595.0m falling due after that. Offsetting this, it had JP¥1.88b in cash and JP¥717.0m in receivables that were due within 12 months. So it actually has JP¥258.0m more liquid assets than total liabilities.
This short term liquidity is a sign that Lancers could probably pay off its debt with ease, as its balance sheet is far from stretched. Simply put, the fact that Lancers has more cash than debt is arguably a good indication that it can manage its debt safely.
Although Lancers made a loss at the EBIT level, last year, it was also good to see that it generated JP¥76m in EBIT over the last twelve months. The balance sheet is clearly the area to focus on when you are analysing debt. But it is Lancers's earnings that will influence how the balance sheet holds up in the future. So if you're keen to discover more about its earnings, it might be worth checking out this graph of its long term earnings trend.
But our final consideration is also important, because a company cannot pay debt with paper profits; it needs cold hard cash. While Lancers has net cash on its balance sheet, it's still worth taking a look at its ability to convert earnings before interest and tax (EBIT) to free cash flow, to help us understand how quickly it is building (or eroding) that cash balance. Happily for any shareholders, Lancers actually produced more free cash flow than EBIT over the last year. There's nothing better than incoming cash when it comes to staying in your lenders' good graces.
Summing Up
While we empathize with investors who find debt concerning, you should keep in mind that Lancers has net cash of JP¥1.22b, as well as more liquid assets than liabilities. The cherry on top was that in converted 291% of that EBIT to free cash flow, bringing in JP¥221m. So we don't think Lancers's use of debt is risky. The balance sheet is clearly the area to focus on when you are analysing debt. But ultimately, every company can contain risks that exist outside of the balance sheet. Case in point: We've spotted 3 warning signs for Lancers you should be aware of.
When all is said and done, sometimes its easier to focus on companies that don't even need debt. Readers can access a list of growth stocks with zero net debt 100% free, right now.
New: AI Stock Screener & Alerts
Our new AI Stock Screener scans the market every day to uncover opportunities.
• Dividend Powerhouses (3%+ Yield)
• Undervalued Small Caps with Insider Buying
• High growth Tech and AI Companies
Or build your own from over 50 metrics.
Have feedback on this article? Concerned about the content? Get in touch with us directly. Alternatively, email editorial-team (at) simplywallst.com.
This article by Simply Wall St is general in nature. We provide commentary based on historical data and analyst forecasts only using an unbiased methodology and our articles are not intended to be financial advice. It does not constitute a recommendation to buy or sell any stock, and does not take account of your objectives, or your financial situation. We aim to bring you long-term focused analysis driven by fundamental data. Note that our analysis may not factor in the latest price-sensitive company announcements or qualitative material. Simply Wall St has no position in any stocks mentioned.
Have feedback on this article? Concerned about the content? Get in touch with us directly. Alternatively, email editorial-team@simplywallst.com
About TSE:4484
Adequate balance sheet with very low risk.
Market Insights

Advertisement
Community Narratives
MicroVision will explode future revenue by 380.37% with a vision towards success
Fair Value US$60.00|98.5% undervalued
TH
Community Contributor
The Indispensable Artery for a New North American Economy
Fair Value CA$132.87|2.3% undervalued
TI
Community Contributor