
Advertisement
- Japan
- /
- Entertainment
- /
- TSE:3928
Mynet Inc.'s (TSE:3928) Shares Bounce 39% But Its Business Still Trails The Industry
Mynet Inc. (TSE:3928) shareholders have had their patience rewarded with a 39% share price jump in the last month. Taking a wider view, although not as strong as the last month, the full year gain of 15% is also fairly reasonable.
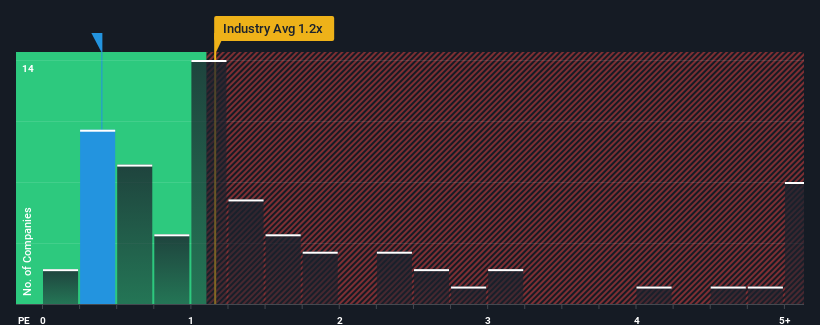
Although its price has surged higher, it would still be understandable if you think Mynet is a stock with good investment prospects with a price-to-sales ratios (or "P/S") of 0.4x, considering almost half the companies in Japan's Entertainment industry have P/S ratios above 1.2x. Although, it's not wise to just take the P/S at face value as there may be an explanation why it's limited.
View our latest analysis for Mynet
How Has Mynet Performed Recently?
As an illustration, revenue has deteriorated at Mynet over the last year, which is not ideal at all. It might be that many expect the disappointing revenue performance to continue or accelerate, which has repressed the P/S. If you like the company, you'd be hoping this isn't the case so that you could potentially pick up some stock while it's out of favour.
Want the full picture on earnings, revenue and cash flow for the company? Then our free report on Mynet will help you shine a light on its historical performance.Do Revenue Forecasts Match The Low P/S Ratio?
Mynet's P/S ratio would be typical for a company that's only expected to deliver limited growth, and importantly, perform worse than the industry.
Taking a look back first, the company's revenue growth last year wasn't something to get excited about as it posted a disappointing decline of 17%. This means it has also seen a slide in revenue over the longer-term as revenue is down 24% in total over the last three years. So unfortunately, we have to acknowledge that the company has not done a great job of growing revenue over that time.
Comparing that to the industry, which is predicted to shrink 0.09% in the next 12 months, the company's downward momentum is still inferior based on recent medium-term annualised revenue results.
With this information, it's not too hard to see why Mynet is trading at a lower P/S in comparison. Nonetheless, with revenue going quickly in reverse, it's not guaranteed that the P/S has found a floor yet. Even just maintaining these prices will be difficult to achieve as recent revenue trends are already weighing down the shares heavily.
The Key Takeaway
Despite Mynet's share price climbing recently, its P/S still lags most other companies. Generally, our preference is to limit the use of the price-to-sales ratio to establishing what the market thinks about the overall health of a company.
As expected, our analysis of Mynet confirms that the company's severe contraction in revenue over the past three-year years is a major contributor to its lower than industry P/S, given the industry is set to decline less. At this stage investors feel the potential for an improvement in revenue isn't great enough to justify a higher P/S ratio. However, we're still cautious about the company's ability to prevent an acceleration of its recent medium-term course and resist even greater pain to its business from the broader industry turmoil. For now though, it's hard to see the share price rising strongly in the near future under these circumstances.
And what about other risks? Every company has them, and we've spotted 3 warning signs for Mynet (of which 1 doesn't sit too well with us!) you should know about.
If strong companies turning a profit tickle your fancy, then you'll want to check out this free list of interesting companies that trade on a low P/E (but have proven they can grow earnings).
New: Manage All Your Stock Portfolios in One Place
We've created the ultimate portfolio companion for stock investors, and it's free.
• Connect an unlimited number of Portfolios and see your total in one currency
• Be alerted to new Warning Signs or Risks via email or mobile
• Track the Fair Value of your stocks
Have feedback on this article? Concerned about the content? Get in touch with us directly. Alternatively, email editorial-team (at) simplywallst.com.
This article by Simply Wall St is general in nature. We provide commentary based on historical data and analyst forecasts only using an unbiased methodology and our articles are not intended to be financial advice. It does not constitute a recommendation to buy or sell any stock, and does not take account of your objectives, or your financial situation. We aim to bring you long-term focused analysis driven by fundamental data. Note that our analysis may not factor in the latest price-sensitive company announcements or qualitative material. Simply Wall St has no position in any stocks mentioned.
About TSE:3928
Excellent balance sheet and good value.
Market Insights

Advertisement
Community Narratives
MicroVision will explode future revenue by 380.37% with a vision towards success
Fair Value US$60|98.4% undervalued
TH
Community Contributor
The Indispensable Artery for a New North American Economy
Fair Value CA$132.87|0.6% undervalued
TI
Community Contributor
Recently Updated Narratives
MA


MarkoVT on COVER ·
Q3 Outlook modestly optimistic
Fair Value:JP¥1.65k2.0% overvalued
1 followerusers have followed this narrative
0 commentsusers have commented on this narrative
0 likesusers have liked this narrative
BL


BlackGoat on Alphabet ·
Alphabet: The Under-appreciated Compounder Hiding in Plain Sight
Fair Value:US$324.481.3% undervalued
76 followersusers have followed this narrative
3 commentsusers have commented on this narrative
1 likeusers have liked this narrative
BE


Bejgal on MINISO Group Holding ·
MINISO's fair value is projected at 26.69 with an anticipated PE ratio shift of 20x
Fair Value:US$26.6926.7% undervalued
46 followersusers have followed this narrative
3 commentsusers have commented on this narrative
0 likesusers have liked this narrative
Popular Narratives
OS

oscargarcia on Alphabet ·
The company that turned a verb into a global necessity and basically runs the modern internet, digital ads, smartphones, maps, and AI.
Fair Value:US$3405.9% undervalued
136 followersusers have followed this narrative
6 commentsusers have commented on this narrative
18 likesusers have liked this narrative
TH

TheWallstreetKing on MicroVision ·
MicroVision will explode future revenue by 380.37% with a vision towards success
Fair Value:US$6098.4% undervalued
90 followersusers have followed this narrative
10 commentsusers have commented on this narrative
18 likesusers have liked this narrative
AN


AnalystConsensusTarget on NVIDIA ·
NVDA: Expanding AI Demand Will Drive Major Data Center Investments Through 2026
Fair Value:US$232.7922.6% undervalued
928 followersusers have followed this narrative
6 commentsusers have commented on this narrative
22 likesusers have liked this narrative