
Advertisement
- Japan
- /
- Interactive Media and Services
- /
- TSE:3901
MarkLines Co., Ltd.'s (TSE:3901) Fundamentals Look Pretty Strong: Could The Market Be Wrong About The Stock?

MarkLines (TSE:3901) has had a rough three months with its share price down 11%. However, a closer look at its sound financials might cause you to think again. Given that fundamentals usually drive long-term market outcomes, the company is worth looking at. In this article, we decided to focus on MarkLines' ROE.
Return on equity or ROE is a key measure used to assess how efficiently a company's management is utilizing the company's capital. In other words, it is a profitability ratio which measures the rate of return on the capital provided by the company's shareholders.
View our latest analysis for MarkLines
How To Calculate Return On Equity?
ROE can be calculated by using the formula:
Return on Equity = Net Profit (from continuing operations) ÷ Shareholders' Equity
So, based on the above formula, the ROE for MarkLines is:
26% = JP¥1.5b ÷ JP¥5.5b (Based on the trailing twelve months to March 2024).
The 'return' is the income the business earned over the last year. That means that for every ¥1 worth of shareholders' equity, the company generated ¥0.26 in profit.
What Is The Relationship Between ROE And Earnings Growth?
So far, we've learned that ROE is a measure of a company's profitability. We now need to evaluate how much profit the company reinvests or "retains" for future growth which then gives us an idea about the growth potential of the company. Assuming all else is equal, companies that have both a higher return on equity and higher profit retention are usually the ones that have a higher growth rate when compared to companies that don't have the same features.
MarkLines' Earnings Growth And 26% ROE
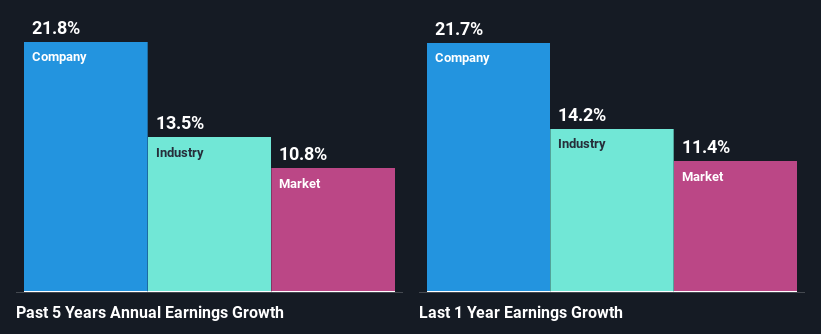
First thing first, we like that MarkLines has an impressive ROE. Additionally, the company's ROE is higher compared to the industry average of 14% which is quite remarkable. Under the circumstances, MarkLines' considerable five year net income growth of 22% was to be expected.
As a next step, we compared MarkLines' net income growth with the industry, and pleasingly, we found that the growth seen by the company is higher than the average industry growth of 13%.
Earnings growth is an important metric to consider when valuing a stock. The investor should try to establish if the expected growth or decline in earnings, whichever the case may be, is priced in. By doing so, they will have an idea if the stock is headed into clear blue waters or if swampy waters await. Is MarkLines fairly valued compared to other companies? These 3 valuation measures might help you decide.
Is MarkLines Efficiently Re-investing Its Profits?
MarkLines' three-year median payout ratio is a pretty moderate 32%, meaning the company retains 68% of its income. So it seems that MarkLines is reinvesting efficiently in a way that it sees impressive growth in its earnings (discussed above) and pays a dividend that's well covered.
Besides, MarkLines has been paying dividends over a period of nine years. This shows that the company is committed to sharing profits with its shareholders.
Summary
In total, we are pretty happy with MarkLines' performance. Specifically, we like that the company is reinvesting a huge chunk of its profits at a high rate of return. This of course has caused the company to see substantial growth in its earnings. On studying current analyst estimates, we found that analysts expect the company to continue its recent growth streak. To know more about the latest analysts predictions for the company, check out this visualization of analyst forecasts for the company.
New: Manage All Your Stock Portfolios in One Place
We've created the ultimate portfolio companion for stock investors, and it's free.
• Connect an unlimited number of Portfolios and see your total in one currency
• Be alerted to new Warning Signs or Risks via email or mobile
• Track the Fair Value of your stocks
Have feedback on this article? Concerned about the content? Get in touch with us directly. Alternatively, email editorial-team (at) simplywallst.com.
This article by Simply Wall St is general in nature. We provide commentary based on historical data and analyst forecasts only using an unbiased methodology and our articles are not intended to be financial advice. It does not constitute a recommendation to buy or sell any stock, and does not take account of your objectives, or your financial situation. We aim to bring you long-term focused analysis driven by fundamental data. Note that our analysis may not factor in the latest price-sensitive company announcements or qualitative material. Simply Wall St has no position in any stocks mentioned.
Have feedback on this article? Concerned about the content? Get in touch with us directly. Alternatively, email editorial-team@simplywallst.com
About TSE:3901
MarkLines
Operates an automotive industry portal in Japan, China, rest of Asia, North America, Europe, and internationally.
Flawless balance sheet established dividend payer.
Market Insights


Advertisement
Community Narratives
MicroStrategy: Volatile Gamble or Golden Opportunity?
Fair Value US$663.00|31.2% undervalued
BL
Community Contributor
Emerging Markets and Debt Reduction Will Propel Bath & Body Works Forward
Fair Value US$40.73|24.4% undervalued
ZW
Community Contributor
An amazing opportunity to potentially get a 100 bagger
Fair Value US$10.00|13.5% overvalued
DA
Community Contributor