
Advertisement
- Japan
- /
- Entertainment
- /
- TSE:3793
Drecom Co.,Ltd.'s (TSE:3793) Share Price Is Still Matching Investor Opinion Despite 26% Slump

The Drecom Co.,Ltd. (TSE:3793) share price has fared very poorly over the last month, falling by a substantial 26%. Indeed, the recent drop has reduced its annual gain to a relatively sedate 4.5% over the last twelve months.
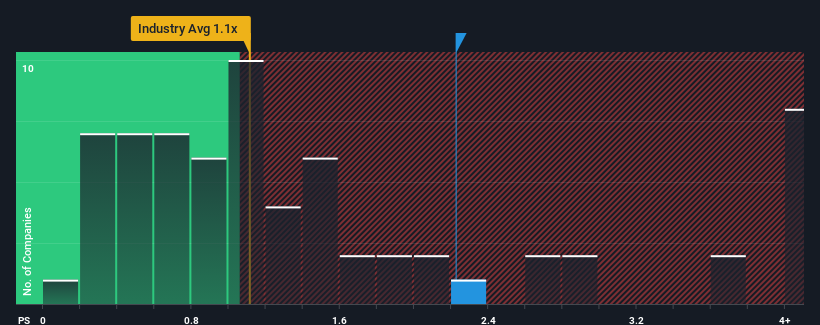
Although its price has dipped substantially, when almost half of the companies in Japan's Entertainment industry have price-to-sales ratios (or "P/S") below 1.1x, you may still consider DrecomLtd as a stock probably not worth researching with its 2.2x P/S ratio. However, the P/S might be high for a reason and it requires further investigation to determine if it's justified.
See our latest analysis for DrecomLtd
How Has DrecomLtd Performed Recently?
DrecomLtd hasn't been tracking well recently as its declining revenue compares poorly to other companies, which have seen some growth in their revenues on average. One possibility is that the P/S ratio is high because investors think this poor revenue performance will turn the corner. You'd really hope so, otherwise you're paying a pretty hefty price for no particular reason.
Want the full picture on analyst estimates for the company? Then our free report on DrecomLtd will help you uncover what's on the horizon.What Are Revenue Growth Metrics Telling Us About The High P/S?
DrecomLtd's P/S ratio would be typical for a company that's expected to deliver solid growth, and importantly, perform better than the industry.
In reviewing the last year of financials, we were disheartened to see the company's revenues fell to the tune of 7.1%. This means it has also seen a slide in revenue over the longer-term as revenue is down 18% in total over the last three years. Therefore, it's fair to say the revenue growth recently has been undesirable for the company.
Looking ahead now, revenue is anticipated to remain buoyant, climbing by 11% during the coming year according to the two analysts following the company. That would be an excellent outcome when the industry is expected to decline by 2.8%.
With this in consideration, we understand why DrecomLtd's P/S is a cut above its industry peers. Right now, investors are willing to pay more for a stock that is shaping up to buck the trend of the broader industry going backwards.
The Bottom Line On DrecomLtd's P/S
There's still some elevation in DrecomLtd's P/S, even if the same can't be said for its share price recently. While the price-to-sales ratio shouldn't be the defining factor in whether you buy a stock or not, it's quite a capable barometer of revenue expectations.
We can see that DrecomLtd maintains its high P/S on the strength of its forecast growth potentially beating a struggling industry, as expected. At this stage investors feel the potential for a deterioration in revenue is remote enough to justify paying a premium in the form of a high P/S. Questions could still raised over whether this level of outperformance can continue in the context of a a tumultuous industry climate. Although, if the company's prospects don't change they will continue to provide strong support to the share price.
It's always necessary to consider the ever-present spectre of investment risk. We've identified 3 warning signs with DrecomLtd (at least 1 which can't be ignored), and understanding these should be part of your investment process.
If strong companies turning a profit tickle your fancy, then you'll want to check out this free list of interesting companies that trade on a low P/E (but have proven they can grow earnings).
New: Manage All Your Stock Portfolios in One Place
We've created the ultimate portfolio companion for stock investors, and it's free.
• Connect an unlimited number of Portfolios and see your total in one currency
• Be alerted to new Warning Signs or Risks via email or mobile
• Track the Fair Value of your stocks
Have feedback on this article? Concerned about the content? Get in touch with us directly. Alternatively, email editorial-team (at) simplywallst.com.
This article by Simply Wall St is general in nature. We provide commentary based on historical data and analyst forecasts only using an unbiased methodology and our articles are not intended to be financial advice. It does not constitute a recommendation to buy or sell any stock, and does not take account of your objectives, or your financial situation. We aim to bring you long-term focused analysis driven by fundamental data. Note that our analysis may not factor in the latest price-sensitive company announcements or qualitative material. Simply Wall St has no position in any stocks mentioned.
About TSE:3793
Reasonable growth potential and fair value.
Market Insights


Advertisement
Community Narratives
A Quality Compounder Marked Down on Overblown Fears
Fair Value US$120.72|59.6% undervalued
BA
Community Contributor

Wyndham Continues Global Expansion with 19% Ancillary Revenue Growth
Fair Value US$105.80|20.8% undervalued
ZW
Community Contributor