
Advertisement
- Japan
- /
- Interactive Media and Services
- /
- TSE:3690
These 4 Measures Indicate That YRGLM (TSE:3690) Is Using Debt Reasonably Well

Warren Buffett famously said, 'Volatility is far from synonymous with risk.' It's only natural to consider a company's balance sheet when you examine how risky it is, since debt is often involved when a business collapses. Importantly, YRGLM Inc. (TSE:3690) does carry debt. But should shareholders be worried about its use of debt?
When Is Debt A Problem?
Debt is a tool to help businesses grow, but if a business is incapable of paying off its lenders, then it exists at their mercy. Part and parcel of capitalism is the process of 'creative destruction' where failed businesses are mercilessly liquidated by their bankers. However, a more common (but still painful) scenario is that it has to raise new equity capital at a low price, thus permanently diluting shareholders. Of course, debt can be an important tool in businesses, particularly capital heavy businesses. When we examine debt levels, we first consider both cash and debt levels, together.
View our latest analysis for YRGLM
What Is YRGLM's Net Debt?
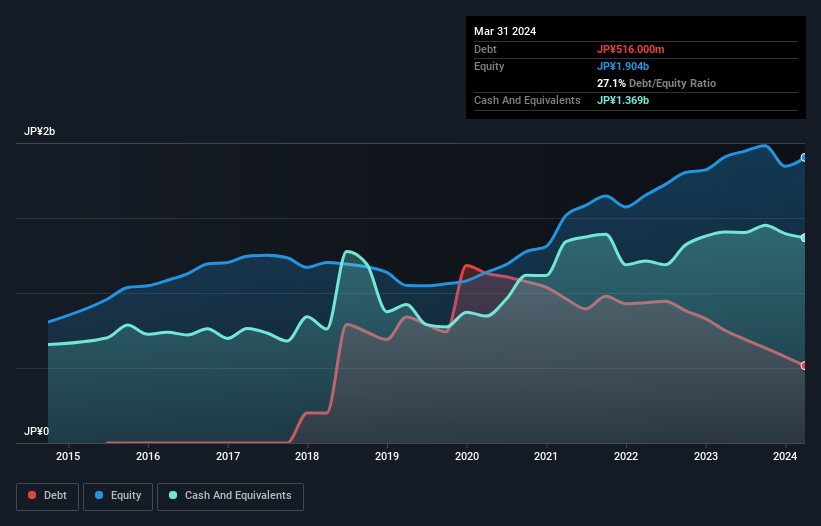
As you can see below, YRGLM had JP¥516.0m of debt at March 2024, down from JP¥750.0m a year prior. However, its balance sheet shows it holds JP¥1.37b in cash, so it actually has JP¥853.0m net cash.
A Look At YRGLM's Liabilities
Zooming in on the latest balance sheet data, we can see that YRGLM had liabilities of JP¥988.0m due within 12 months and liabilities of JP¥85.0m due beyond that. On the other hand, it had cash of JP¥1.37b and JP¥415.0m worth of receivables due within a year. So it actually has JP¥711.0m more liquid assets than total liabilities.
It's good to see that YRGLM has plenty of liquidity on its balance sheet, suggesting conservative management of liabilities. Due to its strong net asset position, it is not likely to face issues with its lenders. Simply put, the fact that YRGLM has more cash than debt is arguably a good indication that it can manage its debt safely.
It is just as well that YRGLM's load is not too heavy, because its EBIT was down 50% over the last year. Falling earnings (if the trend continues) could eventually make even modest debt quite risky. The balance sheet is clearly the area to focus on when you are analysing debt. But you can't view debt in total isolation; since YRGLM will need earnings to service that debt. So when considering debt, it's definitely worth looking at the earnings trend. Click here for an interactive snapshot.
Finally, a company can only pay off debt with cold hard cash, not accounting profits. While YRGLM has net cash on its balance sheet, it's still worth taking a look at its ability to convert earnings before interest and tax (EBIT) to free cash flow, to help us understand how quickly it is building (or eroding) that cash balance. Happily for any shareholders, YRGLM actually produced more free cash flow than EBIT over the last three years. That sort of strong cash generation warms our hearts like a puppy in a bumblebee suit.
Summing Up
While we empathize with investors who find debt concerning, you should keep in mind that YRGLM has net cash of JP¥853.0m, as well as more liquid assets than liabilities. The cherry on top was that in converted 106% of that EBIT to free cash flow, bringing in JP¥327m. So we don't think YRGLM's use of debt is risky. When analysing debt levels, the balance sheet is the obvious place to start. But ultimately, every company can contain risks that exist outside of the balance sheet. We've identified 2 warning signs with YRGLM , and understanding them should be part of your investment process.
Of course, if you're the type of investor who prefers buying stocks without the burden of debt, then don't hesitate to discover our exclusive list of net cash growth stocks, today.
New: Manage All Your Stock Portfolios in One Place
We've created the ultimate portfolio companion for stock investors, and it's free.
• Connect an unlimited number of Portfolios and see your total in one currency
• Be alerted to new Warning Signs or Risks via email or mobile
• Track the Fair Value of your stocks
Have feedback on this article? Concerned about the content? Get in touch with us directly. Alternatively, email editorial-team (at) simplywallst.com.
This article by Simply Wall St is general in nature. We provide commentary based on historical data and analyst forecasts only using an unbiased methodology and our articles are not intended to be financial advice. It does not constitute a recommendation to buy or sell any stock, and does not take account of your objectives, or your financial situation. We aim to bring you long-term focused analysis driven by fundamental data. Note that our analysis may not factor in the latest price-sensitive company announcements or qualitative material. Simply Wall St has no position in any stocks mentioned.
Have feedback on this article? Concerned about the content? Get in touch with us directly. Alternatively, email editorial-team@simplywallst.com
About TSE:3690
Flawless balance sheet low.
Market Insights


Advertisement
Community Narratives
A case for TSXV:USA to reach USD $5.00 - $9.00 (CAD $7.30–$12.29) by 2029.
Fair Value CA$12.29|91.1% undervalued
AG
Community Contributor
DLocal's Future Growth Fueled by 35% Revenue and Profit Margin Boosts
Fair Value US$195.39|94.2% undervalued
WY
Community Contributor
Historically Cheap, but the Margin of Safety Is Still Thin
Fair Value SEK 232.58|13.2% undervalued
MA
Community Contributor