
Advertisement

The external fund manager backed by Berkshire Hathaway's Charlie Munger, Li Lu, makes no bones about it when he says 'The biggest investment risk is not the volatility of prices, but whether you will suffer a permanent loss of capital.' It's only natural to consider a company's balance sheet when you examine how risky it is, since debt is often involved when a business collapses. We note that Ekitan & Co., Ltd. (TSE:3646) does have debt on its balance sheet. But is this debt a concern to shareholders?
What Risk Does Debt Bring?
Debt assists a business until the business has trouble paying it off, either with new capital or with free cash flow. Ultimately, if the company can't fulfill its legal obligations to repay debt, shareholders could walk away with nothing. However, a more common (but still painful) scenario is that it has to raise new equity capital at a low price, thus permanently diluting shareholders. Having said that, the most common situation is where a company manages its debt reasonably well - and to its own advantage. When we examine debt levels, we first consider both cash and debt levels, together.
What Is Ekitan's Net Debt?
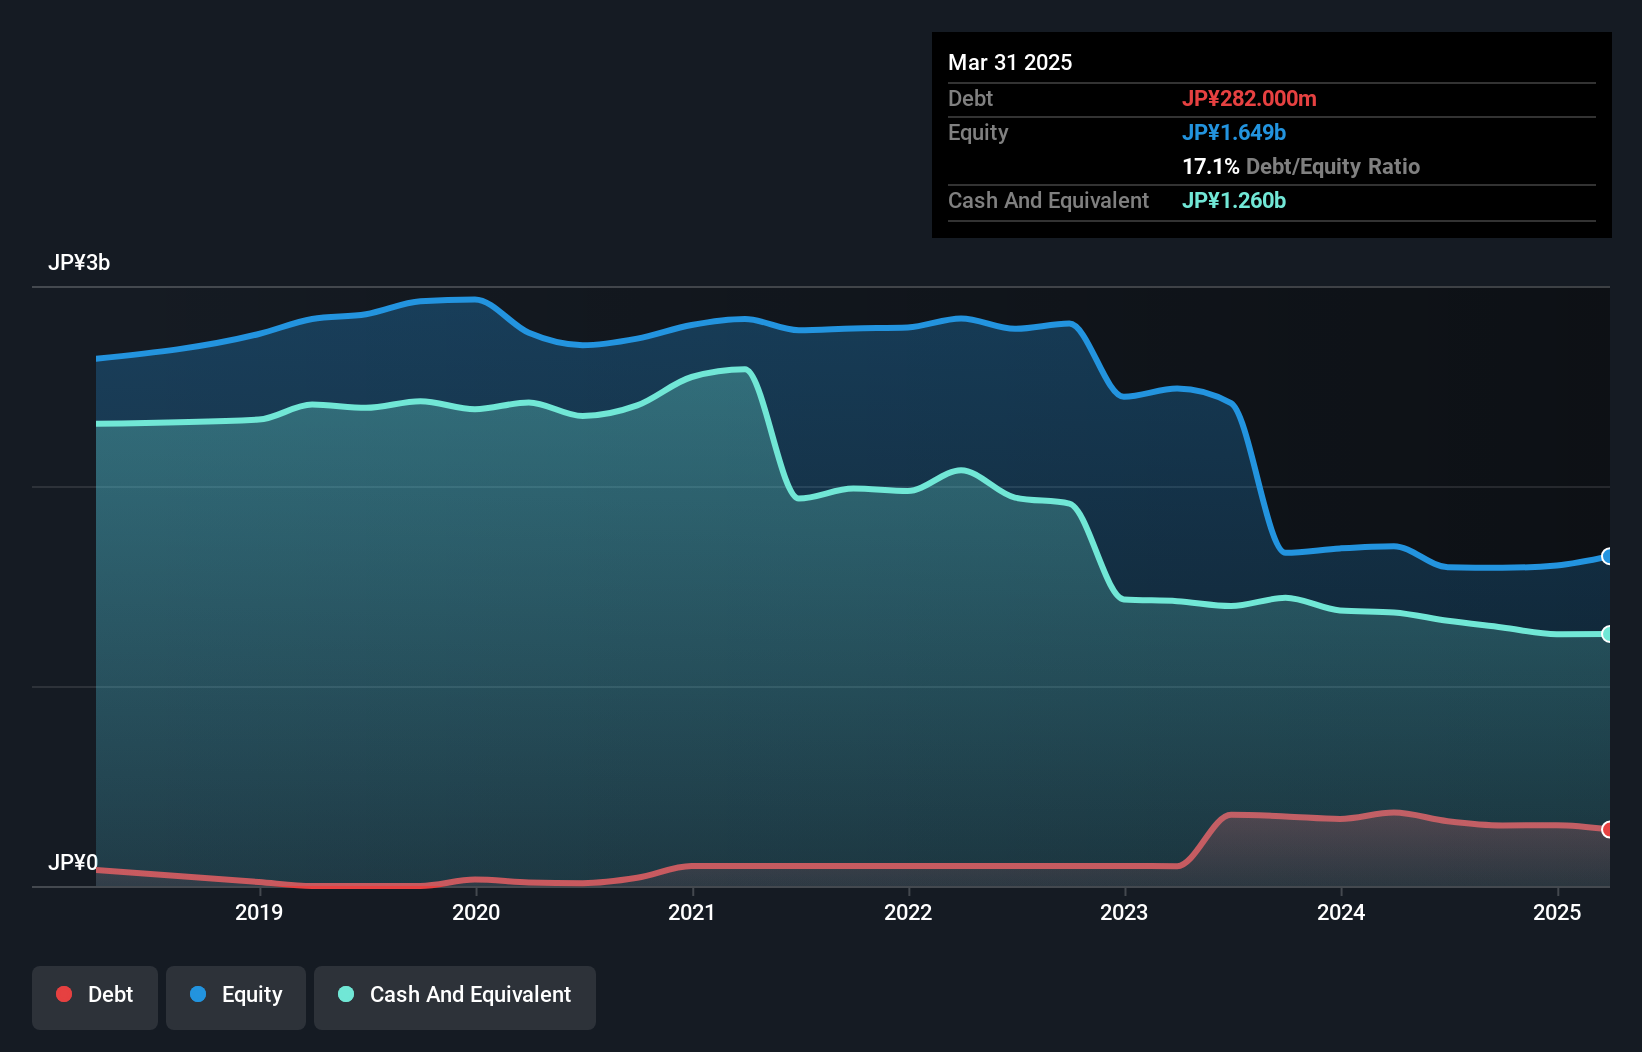
You can click the graphic below for the historical numbers, but it shows that Ekitan had JP¥282.0m of debt in March 2025, down from JP¥367.0m, one year before. But it also has JP¥1.26b in cash to offset that, meaning it has JP¥978.0m net cash.
A Look At Ekitan's Liabilities
Zooming in on the latest balance sheet data, we can see that Ekitan had liabilities of JP¥542.0m due within 12 months and liabilities of JP¥269.0m due beyond that. Offsetting this, it had JP¥1.26b in cash and JP¥523.0m in receivables that were due within 12 months. So it actually has JP¥972.0m more liquid assets than total liabilities.
This excess liquidity is a great indication that Ekitan's balance sheet is almost as strong as Fort Knox. On this view, lenders should feel as safe as the beloved of a black-belt karate master. Simply put, the fact that Ekitan has more cash than debt is arguably a good indication that it can manage its debt safely.
View our latest analysis for Ekitan
Even more impressive was the fact that Ekitan grew its EBIT by 388% over twelve months. If maintained that growth will make the debt even more manageable in the years ahead. The balance sheet is clearly the area to focus on when you are analysing debt. But you can't view debt in total isolation; since Ekitan will need earnings to service that debt. So when considering debt, it's definitely worth looking at the earnings trend. Click here for an interactive snapshot.
Finally, a business needs free cash flow to pay off debt; accounting profits just don't cut it. Ekitan may have net cash on the balance sheet, but it is still interesting to look at how well the business converts its earnings before interest and tax (EBIT) to free cash flow, because that will influence both its need for, and its capacity to manage debt. During the last three years, Ekitan burned a lot of cash. While investors are no doubt expecting a reversal of that situation in due course, it clearly does mean its use of debt is more risky.
Summing Up
While it is always sensible to investigate a company's debt, in this case Ekitan has JP¥978.0m in net cash and a decent-looking balance sheet. And we liked the look of last year's 388% year-on-year EBIT growth. So is Ekitan's debt a risk? It doesn't seem so to us. There's no doubt that we learn most about debt from the balance sheet. But ultimately, every company can contain risks that exist outside of the balance sheet. Case in point: We've spotted 2 warning signs for Ekitan you should be aware of, and 1 of them is concerning.
If you're interested in investing in businesses that can grow profits without the burden of debt, then check out this free list of growing businesses that have net cash on the balance sheet.
Valuation is complex, but we're here to simplify it.
Discover if Ekitan might be undervalued or overvalued with our detailed analysis, featuring fair value estimates, potential risks, dividends, insider trades, and its financial condition.
Access Free AnalysisHave feedback on this article? Concerned about the content? Get in touch with us directly. Alternatively, email editorial-team (at) simplywallst.com.
This article by Simply Wall St is general in nature. We provide commentary based on historical data and analyst forecasts only using an unbiased methodology and our articles are not intended to be financial advice. It does not constitute a recommendation to buy or sell any stock, and does not take account of your objectives, or your financial situation. We aim to bring you long-term focused analysis driven by fundamental data. Note that our analysis may not factor in the latest price-sensitive company announcements or qualitative material. Simply Wall St has no position in any stocks mentioned.
About TSE:3646
Excellent balance sheet with acceptable track record.
Similar Companies
Market Insights


Advertisement
Community Narratives
Alphabet: The Under-appreciated Compounder Hiding in Plain Sight
Fair Value US$282.83|31.8% undervalued
BL
Community Contributor
Planet Labs: At The Heart Of The Emerging New Space Boom
Fair Value US$11.31|44.7% undervalued
AN
Community Contributor
Exxon in Guyana 5 year forecast Low $135 to High $189
Fair Value US$174.00|35.8% undervalued
AG
Community Contributor