
Advertisement
The external fund manager backed by Berkshire Hathaway's Charlie Munger, Li Lu, makes no bones about it when he says 'The biggest investment risk is not the volatility of prices, but whether you will suffer a permanent loss of capital.' When we think about how risky a company is, we always like to look at its use of debt, since debt overload can lead to ruin. We note that DeNA Co., Ltd. (TSE:2432) does have debt on its balance sheet. But the more important question is: how much risk is that debt creating?
What Risk Does Debt Bring?
Generally speaking, debt only becomes a real problem when a company can't easily pay it off, either by raising capital or with its own cash flow. Part and parcel of capitalism is the process of 'creative destruction' where failed businesses are mercilessly liquidated by their bankers. However, a more usual (but still expensive) situation is where a company must dilute shareholders at a cheap share price simply to get debt under control. Having said that, the most common situation is where a company manages its debt reasonably well - and to its own advantage. The first thing to do when considering how much debt a business uses is to look at its cash and debt together.
View our latest analysis for DeNA
How Much Debt Does DeNA Carry?
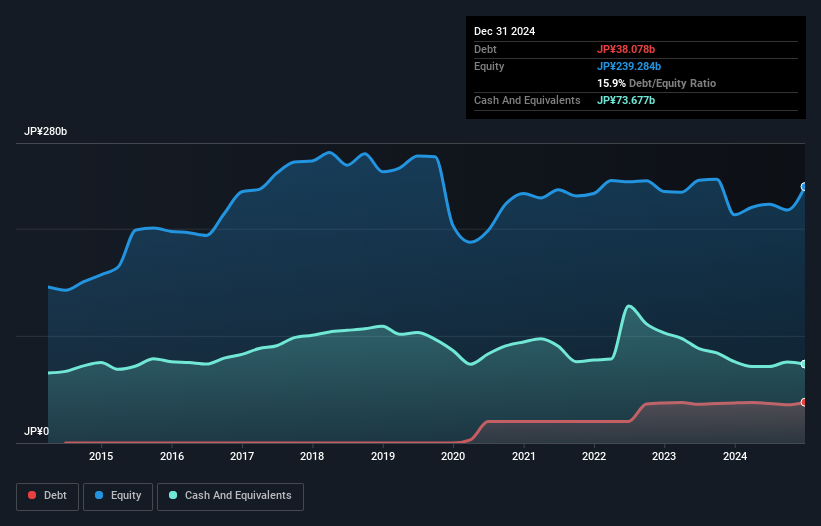
The chart below, which you can click on for greater detail, shows that DeNA had JP¥38.1b in debt in December 2024; about the same as the year before. However, it does have JP¥73.7b in cash offsetting this, leading to net cash of JP¥35.6b.
How Strong Is DeNA's Balance Sheet?
Zooming in on the latest balance sheet data, we can see that DeNA had liabilities of JP¥43.4b due within 12 months and liabilities of JP¥71.3b due beyond that. On the other hand, it had cash of JP¥73.7b and JP¥38.2b worth of receivables due within a year. So its liabilities total JP¥2.83b more than the combination of its cash and short-term receivables.
This state of affairs indicates that DeNA's balance sheet looks quite solid, as its total liabilities are just about equal to its liquid assets. So it's very unlikely that the JP¥408.9b company is short on cash, but still worth keeping an eye on the balance sheet. Despite its noteworthy liabilities, DeNA boasts net cash, so it's fair to say it does not have a heavy debt load!
Although DeNA made a loss at the EBIT level, last year, it was also good to see that it generated JP¥44b in EBIT over the last twelve months. The balance sheet is clearly the area to focus on when you are analysing debt. But it is future earnings, more than anything, that will determine DeNA's ability to maintain a healthy balance sheet going forward. So if you want to see what the professionals think, you might find this free report on analyst profit forecasts to be interesting.
Finally, a business needs free cash flow to pay off debt; accounting profits just don't cut it. While DeNA has net cash on its balance sheet, it's still worth taking a look at its ability to convert earnings before interest and tax (EBIT) to free cash flow, to help us understand how quickly it is building (or eroding) that cash balance. In the last year, DeNA created free cash flow amounting to 11% of its EBIT, an uninspiring performance. That limp level of cash conversion undermines its ability to manage and pay down debt.
Summing Up
We could understand if investors are concerned about DeNA's liabilities, but we can be reassured by the fact it has has net cash of JP¥35.6b. So we are not troubled with DeNA's debt use. When analysing debt levels, the balance sheet is the obvious place to start. However, not all investment risk resides within the balance sheet - far from it. These risks can be hard to spot. Every company has them, and we've spotted 2 warning signs for DeNA (of which 1 is potentially serious!) you should know about.
If, after all that, you're more interested in a fast growing company with a rock-solid balance sheet, then check out our list of net cash growth stocks without delay.
New: Manage All Your Stock Portfolios in One Place
We've created the ultimate portfolio companion for stock investors, and it's free.
• Connect an unlimited number of Portfolios and see your total in one currency
• Be alerted to new Warning Signs or Risks via email or mobile
• Track the Fair Value of your stocks
Have feedback on this article? Concerned about the content? Get in touch with us directly. Alternatively, email editorial-team (at) simplywallst.com.
This article by Simply Wall St is general in nature. We provide commentary based on historical data and analyst forecasts only using an unbiased methodology and our articles are not intended to be financial advice. It does not constitute a recommendation to buy or sell any stock, and does not take account of your objectives, or your financial situation. We aim to bring you long-term focused analysis driven by fundamental data. Note that our analysis may not factor in the latest price-sensitive company announcements or qualitative material. Simply Wall St has no position in any stocks mentioned.
About TSE:2432
Excellent balance sheet and fair value.
Similar Companies
Market Insights

Advertisement
Community Narratives
The company that turned a verb into a global necessity and basically runs the modern internet, digital ads, smartphones, maps, and AI.
Fair Value US$300.00|6.3% undervalued
OS
Community Contributor
Flowers Foods Pays A Fair Price For Health
Fair Value US$16.12|26.0% undervalued
NV
Community Contributor
TMX Group will thrive with 33.3% profit margin and enduring market moat
Fair Value CA$49.90|3.7% overvalued
LI
Community Contributor