
Advertisement
Warren Buffett famously said, 'Volatility is far from synonymous with risk.' So it might be obvious that you need to consider debt, when you think about how risky any given stock is, because too much debt can sink a company. As with many other companies Insight Inc. (SPSE:2172) makes use of debt. But the more important question is: how much risk is that debt creating?
When Is Debt A Problem?
Generally speaking, debt only becomes a real problem when a company can't easily pay it off, either by raising capital or with its own cash flow. Part and parcel of capitalism is the process of 'creative destruction' where failed businesses are mercilessly liquidated by their bankers. However, a more common (but still painful) scenario is that it has to raise new equity capital at a low price, thus permanently diluting shareholders. Having said that, the most common situation is where a company manages its debt reasonably well - and to its own advantage. The first thing to do when considering how much debt a business uses is to look at its cash and debt together.
See our latest analysis for Insight
What Is Insight's Net Debt?
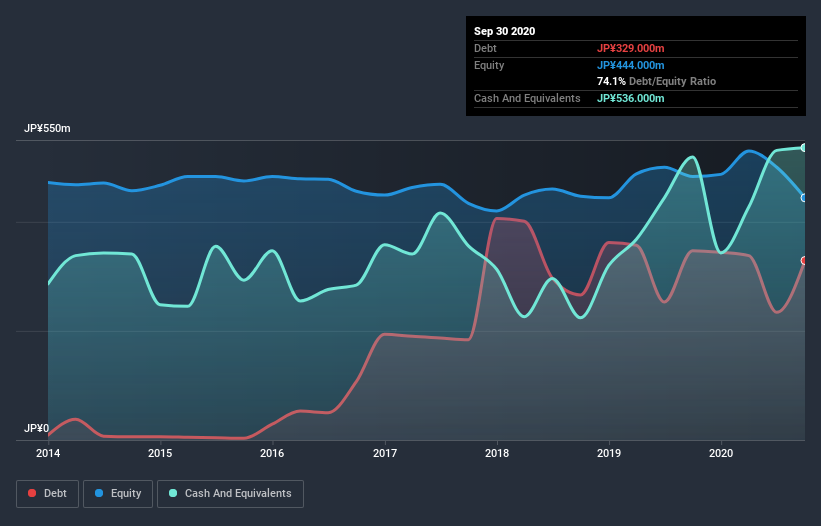
The image below, which you can click on for greater detail, shows that Insight had debt of JP¥304.0m at the end of September 2020, a reduction from JP¥347.0m over a year. But it also has JP¥536.0m in cash to offset that, meaning it has JP¥232.0m net cash.
How Healthy Is Insight's Balance Sheet?
We can see from the most recent balance sheet that Insight had liabilities of JP¥343.0m falling due within a year, and liabilities of JP¥248.0m due beyond that. Offsetting this, it had JP¥536.0m in cash and JP¥194.0m in receivables that were due within 12 months. So it actually has JP¥139.0m more liquid assets than total liabilities.
This surplus suggests that Insight is using debt in a way that is appears to be both safe and conservative. Because it has plenty of assets, it is unlikely to have trouble with its lenders. Simply put, the fact that Insight has more cash than debt is arguably a good indication that it can manage its debt safely. The balance sheet is clearly the area to focus on when you are analysing debt. But it is Insight's earnings that will influence how the balance sheet holds up in the future. So when considering debt, it's definitely worth looking at the earnings trend. Click here for an interactive snapshot.
Over 12 months, Insight made a loss at the EBIT level, and saw its revenue drop to JP¥2.2b, which is a fall of 5.4%. That's not what we would hope to see.
So How Risky Is Insight?
Although Insight had an earnings before interest and tax (EBIT) loss over the last twelve months, it generated positive free cash flow of JP¥126m. So taking that on face value, and considering the net cash situation, we don't think that the stock is too risky in the near term. We'll feel more comfortable with the stock once EBIT is positive, given the lacklustre revenue growth. When analysing debt levels, the balance sheet is the obvious place to start. However, not all investment risk resides within the balance sheet - far from it. To that end, you should learn about the 4 warning signs we've spotted with Insight (including 1 which is concerning) .
Of course, if you're the type of investor who prefers buying stocks without the burden of debt, then don't hesitate to discover our exclusive list of net cash growth stocks, today.
If you’re looking to trade Insight, open an account with the lowest-cost* platform trusted by professionals, Interactive Brokers. Their clients from over 200 countries and territories trade stocks, options, futures, forex, bonds and funds worldwide from a single integrated account. Promoted
New: AI Stock Screener & Alerts
Our new AI Stock Screener scans the market every day to uncover opportunities.
• Dividend Powerhouses (3%+ Yield)
• Undervalued Small Caps with Insider Buying
• High growth Tech and AI Companies
Or build your own from over 50 metrics.
This article by Simply Wall St is general in nature. It does not constitute a recommendation to buy or sell any stock, and does not take account of your objectives, or your financial situation. We aim to bring you long-term focused analysis driven by fundamental data. Note that our analysis may not factor in the latest price-sensitive company announcements or qualitative material. Simply Wall St has no position in any stocks mentioned.
*Interactive Brokers Rated Lowest Cost Broker by StockBrokers.com Annual Online Review 2020
Have feedback on this article? Concerned about the content? Get in touch with us directly. Alternatively, email editorial-team (at) simplywallst.com.
About SPSE:2172
Insight
Provides sales promotions and marketing plans for real estate industry in Japan.
Excellent balance sheet established dividend payer.
Market Insights

Advertisement
Community Narratives
MicroVision will explode future revenue by 380.37% with a vision towards success
Fair Value US$60.00|98.4% undervalued
TH
Community Contributor
The Indispensable Artery for a New North American Economy
Fair Value CA$132.87|1.3% undervalued
TI
Community Contributor