
Advertisement
Yamato Industry Co., Ltd.'s (TSE:7886) P/S Is Still On The Mark Following 31% Share Price Bounce
Those holding Yamato Industry Co., Ltd. (TSE:7886) shares would be relieved that the share price has rebounded 31% in the last thirty days, but it needs to keep going to repair the recent damage it has caused to investor portfolios. But the gains over the last month weren't enough to make shareholders whole, as the share price is still down 5.7% in the last twelve months.
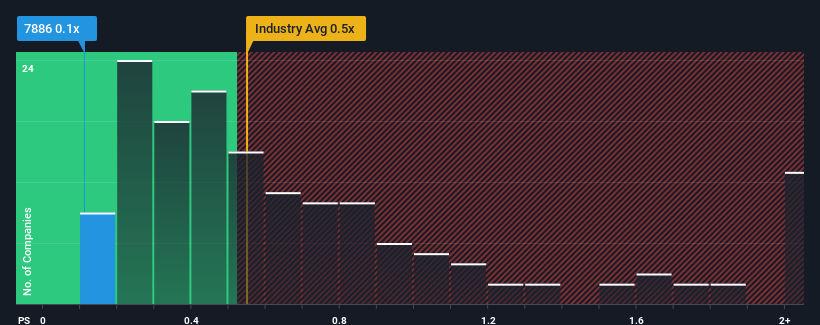
Even after such a large jump in price, it's still not a stretch to say that Yamato Industry's price-to-sales (or "P/S") ratio of 0.1x right now seems quite "middle-of-the-road" compared to the Chemicals industry in Japan, where the median P/S ratio is around 0.5x. However, investors might be overlooking a clear opportunity or potential setback if there is no rational basis for the P/S.
View our latest analysis for Yamato Industry
How Has Yamato Industry Performed Recently?
For instance, Yamato Industry's receding revenue in recent times would have to be some food for thought. Perhaps investors believe the recent revenue performance is enough to keep in line with the industry, which is keeping the P/S from dropping off. If not, then existing shareholders may be a little nervous about the viability of the share price.
Want the full picture on earnings, revenue and cash flow for the company? Then our free report on Yamato Industry will help you shine a light on its historical performance.Is There Some Revenue Growth Forecasted For Yamato Industry?
Yamato Industry's P/S ratio would be typical for a company that's only expected to deliver moderate growth, and importantly, perform in line with the industry.
In reviewing the last year of financials, we were disheartened to see the company's revenues fell to the tune of 1.1%. Regardless, revenue has managed to lift by a handy 18% in aggregate from three years ago, thanks to the earlier period of growth. So we can start by confirming that the company has generally done a good job of growing revenue over that time, even though it had some hiccups along the way.
It's interesting to note that the rest of the industry is similarly expected to grow by 6.6% over the next year, which is fairly even with the company's recent medium-term annualised growth rates.
With this information, we can see why Yamato Industry is trading at a fairly similar P/S to the industry. Apparently shareholders are comfortable to simply hold on assuming the company will continue keeping a low profile.
The Key Takeaway
Yamato Industry's stock has a lot of momentum behind it lately, which has brought its P/S level with the rest of the industry. Using the price-to-sales ratio alone to determine if you should sell your stock isn't sensible, however it can be a practical guide to the company's future prospects.
It appears to us that Yamato Industry maintains its moderate P/S off the back of its recent three-year growth being in line with the wider industry forecast. Right now shareholders are comfortable with the P/S as they are quite confident future revenue won't throw up any surprises. Unless the recent medium-term conditions change, they will continue to support the share price at these levels.
Before you take the next step, you should know about the 2 warning signs for Yamato Industry that we have uncovered.
It's important to make sure you look for a great company, not just the first idea you come across. So if growing profitability aligns with your idea of a great company, take a peek at this free list of interesting companies with strong recent earnings growth (and a low P/E).
New: Manage All Your Stock Portfolios in One Place
We've created the ultimate portfolio companion for stock investors, and it's free.
• Connect an unlimited number of Portfolios and see your total in one currency
• Be alerted to new Warning Signs or Risks via email or mobile
• Track the Fair Value of your stocks
Have feedback on this article? Concerned about the content? Get in touch with us directly. Alternatively, email editorial-team (at) simplywallst.com.
This article by Simply Wall St is general in nature. We provide commentary based on historical data and analyst forecasts only using an unbiased methodology and our articles are not intended to be financial advice. It does not constitute a recommendation to buy or sell any stock, and does not take account of your objectives, or your financial situation. We aim to bring you long-term focused analysis driven by fundamental data. Note that our analysis may not factor in the latest price-sensitive company announcements or qualitative material. Simply Wall St has no position in any stocks mentioned.
About TSE:7886
Yamato Mobility & Mfg.Ltd
Primarily engages in the planning, design, manufacturing, and sale of injection molding products in Japan and internationally.
Adequate balance sheet and slightly overvalued.
Market Insights

Advertisement
Community Narratives
MINISO's fair value is projected at 26.69 with an anticipated PE ratio shift of 20x
Fair Value US$24.03|11.0% undervalued
BE
Community Contributor
Procter & Gamble: A Dividend Giant Facing Slowing Growth
Fair Value US$119.81|23.3% overvalued
AN
Community Contributor
Eli Lilly's Future Growth Driven by Tirzepatide and Favorable Market Conditions
Fair Value US$1.19k|13.8% undervalued
EA
Community Contributor