
Advertisement
Some say volatility, rather than debt, is the best way to think about risk as an investor, but Warren Buffett famously said that 'Volatility is far from synonymous with risk.' When we think about how risky a company is, we always like to look at its use of debt, since debt overload can lead to ruin. As with many other companies PILLAR Corporation (TSE:6490) makes use of debt. But is this debt a concern to shareholders?
When Is Debt Dangerous?
Debt and other liabilities become risky for a business when it cannot easily fulfill those obligations, either with free cash flow or by raising capital at an attractive price. Ultimately, if the company can't fulfill its legal obligations to repay debt, shareholders could walk away with nothing. However, a more usual (but still expensive) situation is where a company must dilute shareholders at a cheap share price simply to get debt under control. Of course, plenty of companies use debt to fund growth, without any negative consequences. The first step when considering a company's debt levels is to consider its cash and debt together.
View our latest analysis for PILLAR
What Is PILLAR's Net Debt?
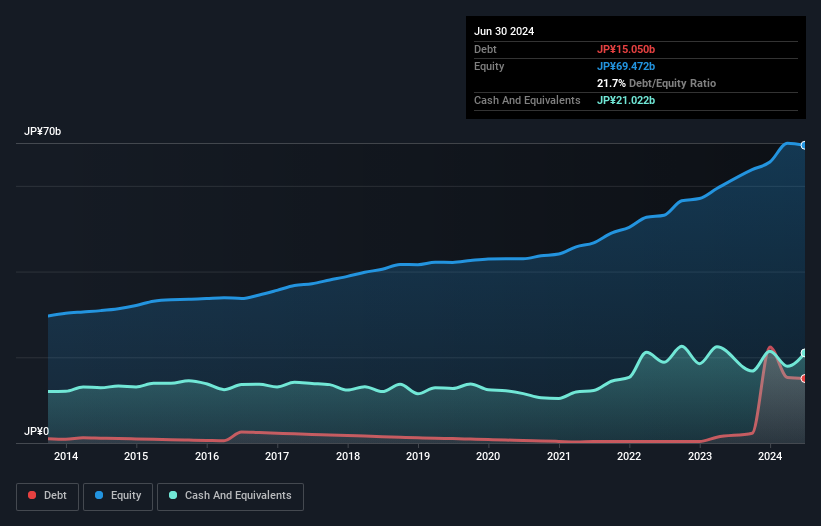
The image below, which you can click on for greater detail, shows that at June 2024 PILLAR had debt of JP¥15.1b, up from JP¥2.28b in one year. But on the other hand it also has JP¥21.0b in cash, leading to a JP¥5.97b net cash position.
A Look At PILLAR's Liabilities
Zooming in on the latest balance sheet data, we can see that PILLAR had liabilities of JP¥14.4b due within 12 months and liabilities of JP¥14.8b due beyond that. Offsetting these obligations, it had cash of JP¥21.0b as well as receivables valued at JP¥18.2b due within 12 months. So it can boast JP¥10.0b more liquid assets than total liabilities.
This short term liquidity is a sign that PILLAR could probably pay off its debt with ease, as its balance sheet is far from stretched. Succinctly put, PILLAR boasts net cash, so it's fair to say it does not have a heavy debt load!
On the other hand, PILLAR saw its EBIT drop by 2.3% in the last twelve months. If earnings continue to decline at that rate the company may have increasing difficulty managing its debt load. When analysing debt levels, the balance sheet is the obvious place to start. But it is future earnings, more than anything, that will determine PILLAR's ability to maintain a healthy balance sheet going forward. So if you want to see what the professionals think, you might find this free report on analyst profit forecasts to be interesting.
Finally, a business needs free cash flow to pay off debt; accounting profits just don't cut it. While PILLAR has net cash on its balance sheet, it's still worth taking a look at its ability to convert earnings before interest and tax (EBIT) to free cash flow, to help us understand how quickly it is building (or eroding) that cash balance. Over the last three years, PILLAR reported free cash flow worth 19% of its EBIT, which is really quite low. For us, cash conversion that low sparks a little paranoia about is ability to extinguish debt.
Summing Up
While it is always sensible to investigate a company's debt, in this case PILLAR has JP¥5.97b in net cash and a decent-looking balance sheet. So we are not troubled with PILLAR's debt use. The balance sheet is clearly the area to focus on when you are analysing debt. However, not all investment risk resides within the balance sheet - far from it. Case in point: We've spotted 1 warning sign for PILLAR you should be aware of.
At the end of the day, it's often better to focus on companies that are free from net debt. You can access our special list of such companies (all with a track record of profit growth). It's free.
New: Manage All Your Stock Portfolios in One Place
We've created the ultimate portfolio companion for stock investors, and it's free.
• Connect an unlimited number of Portfolios and see your total in one currency
• Be alerted to new Warning Signs or Risks via email or mobile
• Track the Fair Value of your stocks
Have feedback on this article? Concerned about the content? Get in touch with us directly. Alternatively, email editorial-team (at) simplywallst.com.
This article by Simply Wall St is general in nature. We provide commentary based on historical data and analyst forecasts only using an unbiased methodology and our articles are not intended to be financial advice. It does not constitute a recommendation to buy or sell any stock, and does not take account of your objectives, or your financial situation. We aim to bring you long-term focused analysis driven by fundamental data. Note that our analysis may not factor in the latest price-sensitive company announcements or qualitative material. Simply Wall St has no position in any stocks mentioned.
About TSE:6490
PILLAR
Designs, develops, manufactures, and sells various fluid control equipment in Japan and internationally.
Excellent balance sheet, good value and pays a dividend.
Market Insights

Advertisement
Community Narratives
The company that turned a verb into a global necessity and basically runs the modern internet, digital ads, smartphones, maps, and AI.
Fair Value US$300.00|10.8% undervalued
OS
Community Contributor
Flowers Foods Pays A Fair Price For Health
Fair Value US$16.12|22.0% undervalued
NV
Community Contributor
TMX Group will thrive with 33.3% profit margin and enduring market moat
Fair Value CA$49.90|3.8% overvalued
LI
Community Contributor