
Advertisement
Is Nippon Pillar Packing Co., Ltd. (TSE:6490) Trading At A 42% Discount?
Key Insights
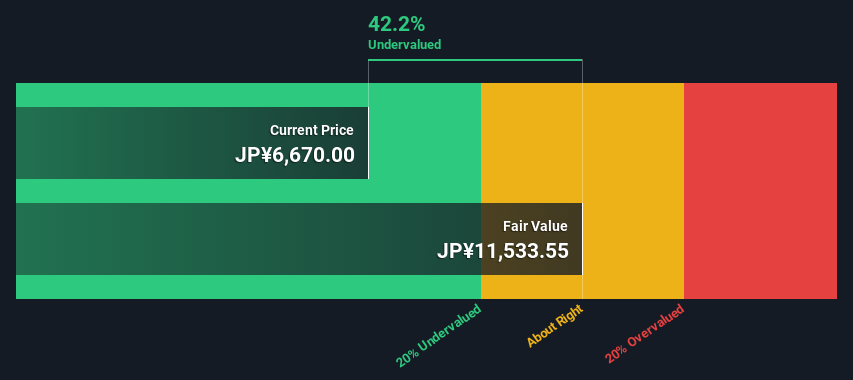
- Nippon Pillar Packing's estimated fair value is JP¥11,534 based on 2 Stage Free Cash Flow to Equity
- Nippon Pillar Packing's JP¥6,670 share price signals that it might be 42% undervalued
- The JP¥7,015 analyst price target for 6490 is 39% less than our estimate of fair value
How far off is Nippon Pillar Packing Co., Ltd. (TSE:6490) from its intrinsic value? Using the most recent financial data, we'll take a look at whether the stock is fairly priced by estimating the company's future cash flows and discounting them to their present value. We will use the Discounted Cash Flow (DCF) model on this occasion. There's really not all that much to it, even though it might appear quite complex.
Companies can be valued in a lot of ways, so we would point out that a DCF is not perfect for every situation. If you want to learn more about discounted cash flow, the rationale behind this calculation can be read in detail in the Simply Wall St analysis model.
See our latest analysis for Nippon Pillar Packing
The Calculation
We are going to use a two-stage DCF model, which, as the name states, takes into account two stages of growth. The first stage is generally a higher growth period which levels off heading towards the terminal value, captured in the second 'steady growth' period. In the first stage we need to estimate the cash flows to the business over the next ten years. Where possible we use analyst estimates, but when these aren't available we extrapolate the previous free cash flow (FCF) from the last estimate or reported value. We assume companies with shrinking free cash flow will slow their rate of shrinkage, and that companies with growing free cash flow will see their growth rate slow, over this period. We do this to reflect that growth tends to slow more in the early years than it does in later years.
A DCF is all about the idea that a dollar in the future is less valuable than a dollar today, so we need to discount the sum of these future cash flows to arrive at a present value estimate:
10-year free cash flow (FCF) forecast
| 2024 | 2025 | 2026 | 2027 | 2028 | 2029 | 2030 | 2031 | 2032 | 2033 | |
| Levered FCF (¥, Millions) | JP¥4.85b | JP¥11.9b | JP¥13.4b | JP¥14.4b | JP¥15.2b | JP¥15.8b | JP¥16.3b | JP¥16.6b | JP¥16.8b | JP¥17.0b |
| Growth Rate Estimate Source | Analyst x1 | Analyst x1 | Analyst x1 | Est @ 7.80% | Est @ 5.52% | Est @ 3.93% | Est @ 2.81% | Est @ 2.03% | Est @ 1.48% | Est @ 1.09% |
| Present Value (¥, Millions) Discounted @ 5.9% | JP¥4.6k | JP¥10.6k | JP¥11.3k | JP¥11.5k | JP¥11.4k | JP¥11.2k | JP¥10.9k | JP¥10.5k | JP¥10.0k | JP¥9.6k |
("Est" = FCF growth rate estimated by Simply Wall St)
Present Value of 10-year Cash Flow (PVCF) = JP¥101b
We now need to calculate the Terminal Value, which accounts for all the future cash flows after this ten year period. The Gordon Growth formula is used to calculate Terminal Value at a future annual growth rate equal to the 5-year average of the 10-year government bond yield of 0.2%. We discount the terminal cash flows to today's value at a cost of equity of 5.9%.
Terminal Value (TV)= FCF2033 × (1 + g) ÷ (r – g) = JP¥17b× (1 + 0.2%) ÷ (5.9%– 0.2%) = JP¥298b
Present Value of Terminal Value (PVTV)= TV / (1 + r)10= JP¥298b÷ ( 1 + 5.9%)10= JP¥167b
The total value is the sum of cash flows for the next ten years plus the discounted terminal value, which results in the Total Equity Value, which in this case is JP¥269b. To get the intrinsic value per share, we divide this by the total number of shares outstanding. Relative to the current share price of JP¥6.7k, the company appears quite good value at a 42% discount to where the stock price trades currently. Remember though, that this is just an approximate valuation, and like any complex formula - garbage in, garbage out.
The Assumptions
We would point out that the most important inputs to a discounted cash flow are the discount rate and of course the actual cash flows. Part of investing is coming up with your own evaluation of a company's future performance, so try the calculation yourself and check your own assumptions. The DCF also does not consider the possible cyclicality of an industry, or a company's future capital requirements, so it does not give a full picture of a company's potential performance. Given that we are looking at Nippon Pillar Packing as potential shareholders, the cost of equity is used as the discount rate, rather than the cost of capital (or weighted average cost of capital, WACC) which accounts for debt. In this calculation we've used 5.9%, which is based on a levered beta of 1.017. Beta is a measure of a stock's volatility, compared to the market as a whole. We get our beta from the industry average beta of globally comparable companies, with an imposed limit between 0.8 and 2.0, which is a reasonable range for a stable business.
SWOT Analysis for Nippon Pillar Packing
Strength
- Earnings growth over the past year exceeded the industry.
- Debt is not viewed as a risk.
Weakness
- Earnings growth over the past year is below its 5-year average.
- Dividend is low compared to the top 25% of dividend payers in the Chemicals market.
Opportunity
- Annual revenue is forecast to grow faster than the Japanese market.
- Trading below our estimate of fair value by more than 20%.
Threat
- Dividends are not covered by cash flow.
- Annual earnings are forecast to grow slower than the Japanese market.
Looking Ahead:
Although the valuation of a company is important, it is only one of many factors that you need to assess for a company. The DCF model is not a perfect stock valuation tool. Instead the best use for a DCF model is to test certain assumptions and theories to see if they would lead to the company being undervalued or overvalued. For instance, if the terminal value growth rate is adjusted slightly, it can dramatically alter the overall result. What is the reason for the share price sitting below the intrinsic value? For Nippon Pillar Packing, there are three further items you should assess:
- Risks: For example, we've discovered 2 warning signs for Nippon Pillar Packing that you should be aware of before investing here.
- Future Earnings: How does 6490's growth rate compare to its peers and the wider market? Dig deeper into the analyst consensus number for the upcoming years by interacting with our free analyst growth expectation chart.
- Other Solid Businesses: Low debt, high returns on equity and good past performance are fundamental to a strong business. Why not explore our interactive list of stocks with solid business fundamentals to see if there are other companies you may not have considered!
PS. Simply Wall St updates its DCF calculation for every Japanese stock every day, so if you want to find the intrinsic value of any other stock just search here.
New: Manage All Your Stock Portfolios in One Place
We've created the ultimate portfolio companion for stock investors, and it's free.
• Connect an unlimited number of Portfolios and see your total in one currency
• Be alerted to new Warning Signs or Risks via email or mobile
• Track the Fair Value of your stocks
Have feedback on this article? Concerned about the content? Get in touch with us directly. Alternatively, email editorial-team (at) simplywallst.com.
This article by Simply Wall St is general in nature. We provide commentary based on historical data and analyst forecasts only using an unbiased methodology and our articles are not intended to be financial advice. It does not constitute a recommendation to buy or sell any stock, and does not take account of your objectives, or your financial situation. We aim to bring you long-term focused analysis driven by fundamental data. Note that our analysis may not factor in the latest price-sensitive company announcements or qualitative material. Simply Wall St has no position in any stocks mentioned.
About TSE:6490
PILLAR
Designs, develops, manufactures, and sells various fluid control equipment in Japan and internationally.
Excellent balance sheet, good value and pays a dividend.
Market Insights

Advertisement
Community Narratives
The company that turned a verb into a global necessity and basically runs the modern internet, digital ads, smartphones, maps, and AI.
Fair Value US$300.00|8.5% undervalued
OS
Community Contributor
Flowers Foods Pays A Fair Price For Health
Fair Value US$16.12|24.6% undervalued
NV
Community Contributor
TMX Group will thrive with 33.3% profit margin and enduring market moat
Fair Value CA$49.90|0.1% undervalued
LI
Community Contributor