
Advertisement
Investors Met With Slowing Returns on Capital At Toyo Seikan Group Holdings (TSE:5901)
If we want to find a potential multi-bagger, often there are underlying trends that can provide clues. In a perfect world, we'd like to see a company investing more capital into its business and ideally the returns earned from that capital are also increasing. This shows us that it's a compounding machine, able to continually reinvest its earnings back into the business and generate higher returns. Having said that, from a first glance at Toyo Seikan Group Holdings (TSE:5901) we aren't jumping out of our chairs at how returns are trending, but let's have a deeper look.
Understanding Return On Capital Employed (ROCE)
If you haven't worked with ROCE before, it measures the 'return' (pre-tax profit) a company generates from capital employed in its business. The formula for this calculation on Toyo Seikan Group Holdings is:
Return on Capital Employed = Earnings Before Interest and Tax (EBIT) ÷ (Total Assets - Current Liabilities)
0.029 = JP¥26b ÷ (JP¥1.2t - JP¥298b) (Based on the trailing twelve months to December 2023).
Thus, Toyo Seikan Group Holdings has an ROCE of 2.9%. Ultimately, that's a low return and it under-performs the Packaging industry average of 5.1%.
Check out our latest analysis for Toyo Seikan Group Holdings
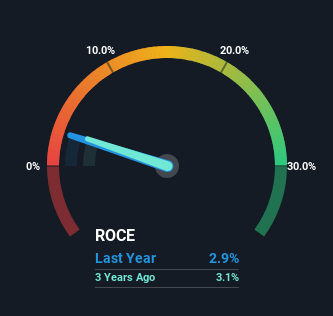
Historical performance is a great place to start when researching a stock so above you can see the gauge for Toyo Seikan Group Holdings' ROCE against it's prior returns. If you're interested in investigating Toyo Seikan Group Holdings' past further, check out this free graph covering Toyo Seikan Group Holdings' past earnings, revenue and cash flow.
What Does the ROCE Trend For Toyo Seikan Group Holdings Tell Us?
There hasn't been much to report for Toyo Seikan Group Holdings' returns and its level of capital employed because both metrics have been steady for the past five years. This tells us the company isn't reinvesting in itself, so it's plausible that it's past the growth phase. So don't be surprised if Toyo Seikan Group Holdings doesn't end up being a multi-bagger in a few years time.
In Conclusion...
In a nutshell, Toyo Seikan Group Holdings has been trudging along with the same returns from the same amount of capital over the last five years. Unsurprisingly, the stock has only gained 27% over the last five years, which potentially indicates that investors are accounting for this going forward. Therefore, if you're looking for a multi-bagger, we'd propose looking at other options.
If you want to continue researching Toyo Seikan Group Holdings, you might be interested to know about the 1 warning sign that our analysis has discovered.
While Toyo Seikan Group Holdings isn't earning the highest return, check out this free list of companies that are earning high returns on equity with solid balance sheets.
Valuation is complex, but we're here to simplify it.
Discover if Toyo Seikan Group Holdings might be undervalued or overvalued with our detailed analysis, featuring fair value estimates, potential risks, dividends, insider trades, and its financial condition.
Access Free AnalysisHave feedback on this article? Concerned about the content? Get in touch with us directly. Alternatively, email editorial-team (at) simplywallst.com.
This article by Simply Wall St is general in nature. We provide commentary based on historical data and analyst forecasts only using an unbiased methodology and our articles are not intended to be financial advice. It does not constitute a recommendation to buy or sell any stock, and does not take account of your objectives, or your financial situation. We aim to bring you long-term focused analysis driven by fundamental data. Note that our analysis may not factor in the latest price-sensitive company announcements or qualitative material. Simply Wall St has no position in any stocks mentioned.
About TSE:5901
Toyo Seikan Group Holdings
Manufactures and sells packaging containers in Japan, rest of Asia, and internationally.
Solid track record with excellent balance sheet and pays a dividend.
Similar Companies
Market Insights

Advertisement
Community Narratives
MINISO's fair value is projected at 26.69 with an anticipated PE ratio shift of 20x
Fair Value US$24.03|11.0% undervalued
BE
Community Contributor
Procter & Gamble: A Dividend Giant Facing Slowing Growth
Fair Value US$119.81|23.3% overvalued
AN
Community Contributor
Eli Lilly's Future Growth Driven by Tirzepatide and Favorable Market Conditions
Fair Value US$1.19k|13.8% undervalued
EA
Community Contributor