

Amid a week of significant losses for Japan's stock markets, with the Nikkei 225 Index falling 4.7% and the broader TOPIX Index down 6.0%, investors are increasingly looking for stable income sources. In this environment, dividend stocks can offer a reliable stream of income, making them an attractive option for those seeking to navigate market volatility effectively.
Top 10 Dividend Stocks In Japan
| Name | Dividend Yield | Dividend Rating |
| Yamato Kogyo (TSE:5444) | 4.81% | ★★★★★★ |
| Tsubakimoto Chain (TSE:6371) | 4.55% | ★★★★★★ |
| Mitsubishi Shokuhin (TSE:7451) | 4.37% | ★★★★★★ |
| Globeride (TSE:7990) | 4.57% | ★★★★★★ |
| Mitsubishi Research Institute (TSE:3636) | 4.43% | ★★★★★★ |
| Kondotec (TSE:7438) | 4.02% | ★★★★★★ |
| Nihon Parkerizing (TSE:4095) | 4.04% | ★★★★★★ |
| E J Holdings (TSE:2153) | 4.39% | ★★★★★★ |
| DoshishaLtd (TSE:7483) | 3.84% | ★★★★★★ |
| Maezawa Kasei Industries (TSE:7925) | 3.84% | ★★★★★★ |
Click here to see the full list of 576 stocks from our Top Japanese Dividend Stocks screener.
Let's review some notable picks from our screened stocks.
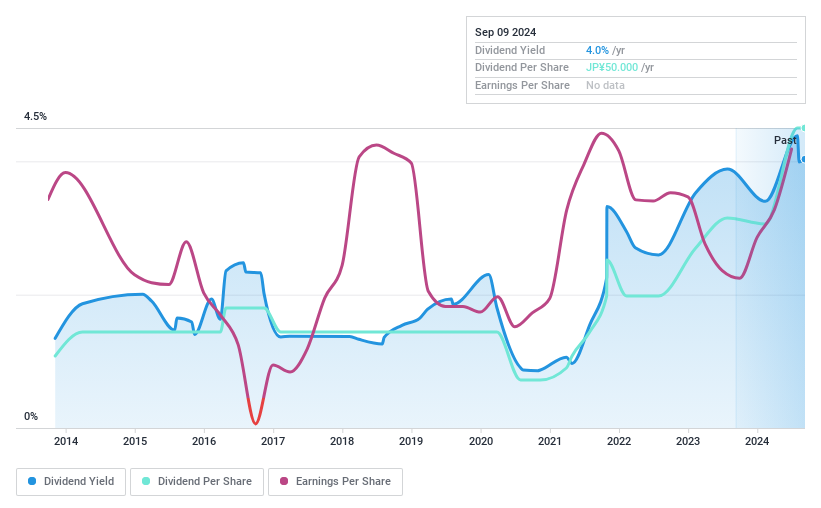
Nicca ChemicalLtd (TSE:4463)
Simply Wall St Dividend Rating: ★★★★☆☆
Overview: Nicca Chemical Co., Ltd. manufactures and sells surfactants for various industries including textiles, metals, pulp and paper, paints, dyes, synthetic resins, and professional cleaning agents both in Japan and internationally with a market cap of ¥16.72 billion.
Operations: Nicca Chemical Co., Ltd. generates revenue by producing and distributing surfactants for industries such as textiles, metals, pulp and paper, paints, dyes, synthetic resins, and professional cleaning agents in both domestic and international markets.
Dividend Yield: 3.2%
Nicca Chemical Ltd. offers a mixed outlook for dividend investors. While its dividend payments have increased over the past decade and are well-covered by both earnings (payout ratio: 9.6%) and cash flows (cash payout ratio: 16.2%), the payments have been volatile, showing instability in their track record. Additionally, the stock trades at 73.8% below estimated fair value but has experienced high volatility recently and provides a relatively low yield of 3.21%.
- Get an in-depth perspective on Nicca ChemicalLtd's performance by reading our dividend report here.
- Our valuation report here indicates Nicca ChemicalLtd may be undervalued.
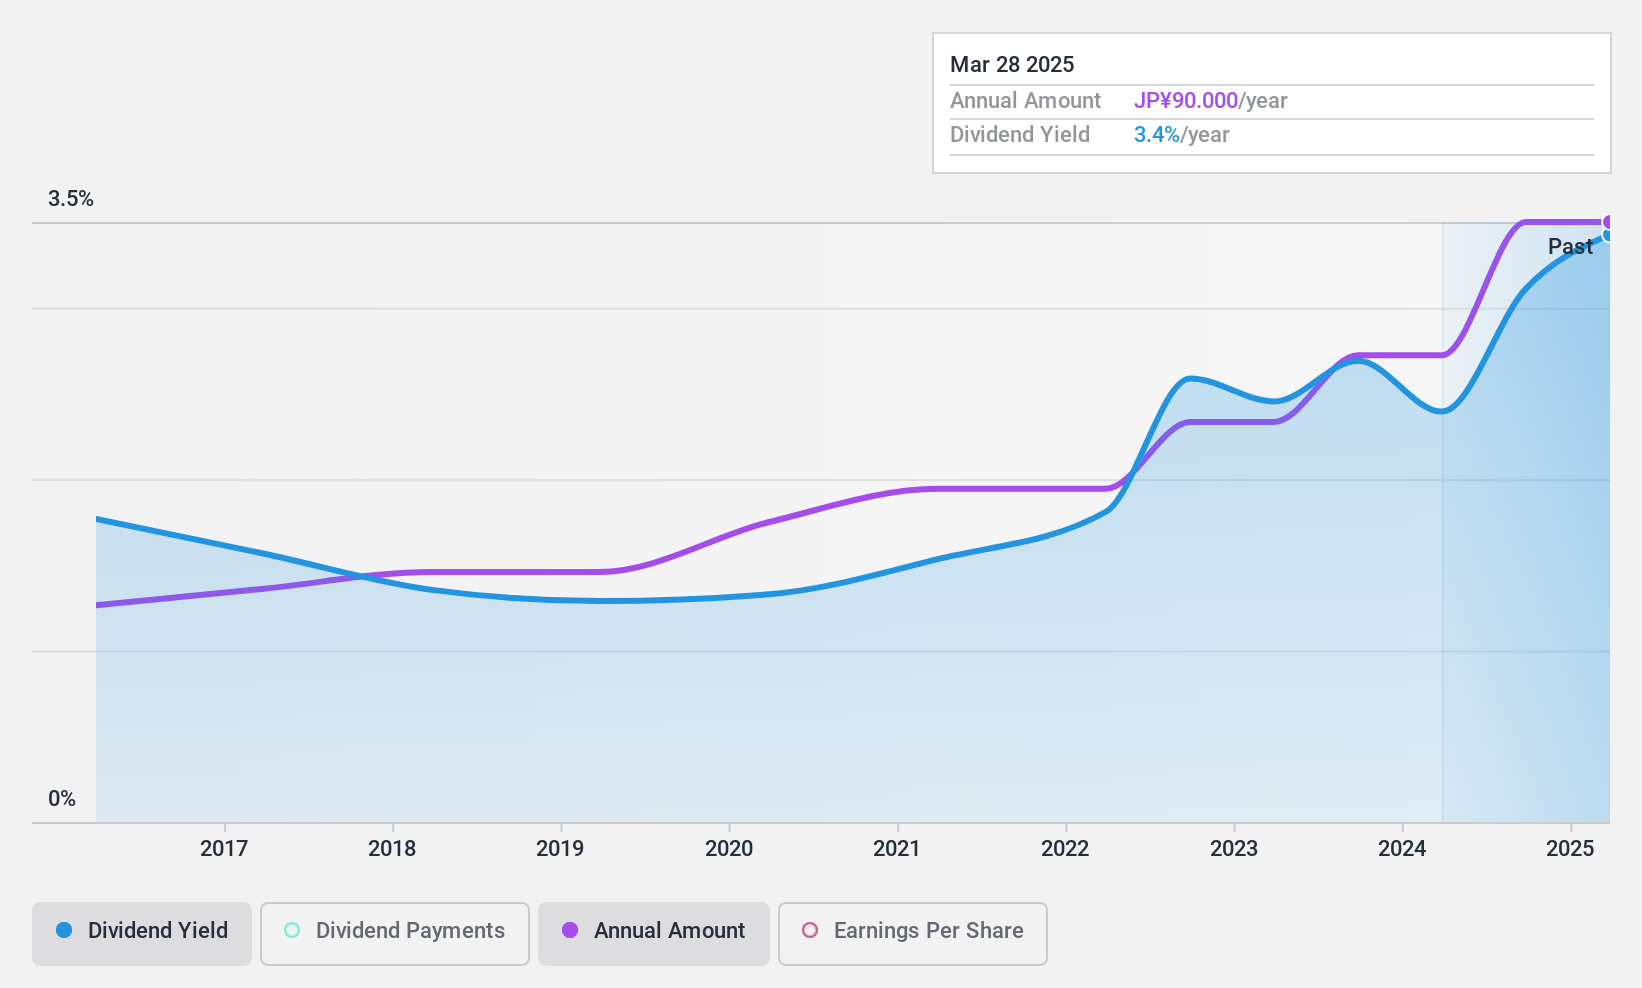
MedikitLtd (TSE:7749)
Simply Wall St Dividend Rating: ★★★★★☆
Overview: Medikit Co., Ltd. (TSE:7749) manufactures and sells vascular access medical devices, with a market cap of ¥44.02 billion.
Operations: Medikit Co., Ltd. generates revenue from the manufacture and sale of vascular access medical devices.
Dividend Yield: 3%
Medikit Ltd.'s dividend payments have been stable and growing over the past decade, with a payout ratio of 42.6% indicating strong coverage by both earnings and cash flows. The stock trades at 50% below its estimated fair value, offering potential for capital appreciation. However, its dividend yield of 3.03% is lower than the top quartile in the Japanese market (3.79%). The upcoming Annual General Meeting on June 26, 2024, may provide further insights into future performance.
- Navigate through the intricacies of MedikitLtd with our comprehensive dividend report here.
- The valuation report we've compiled suggests that MedikitLtd's current price could be quite moderate.
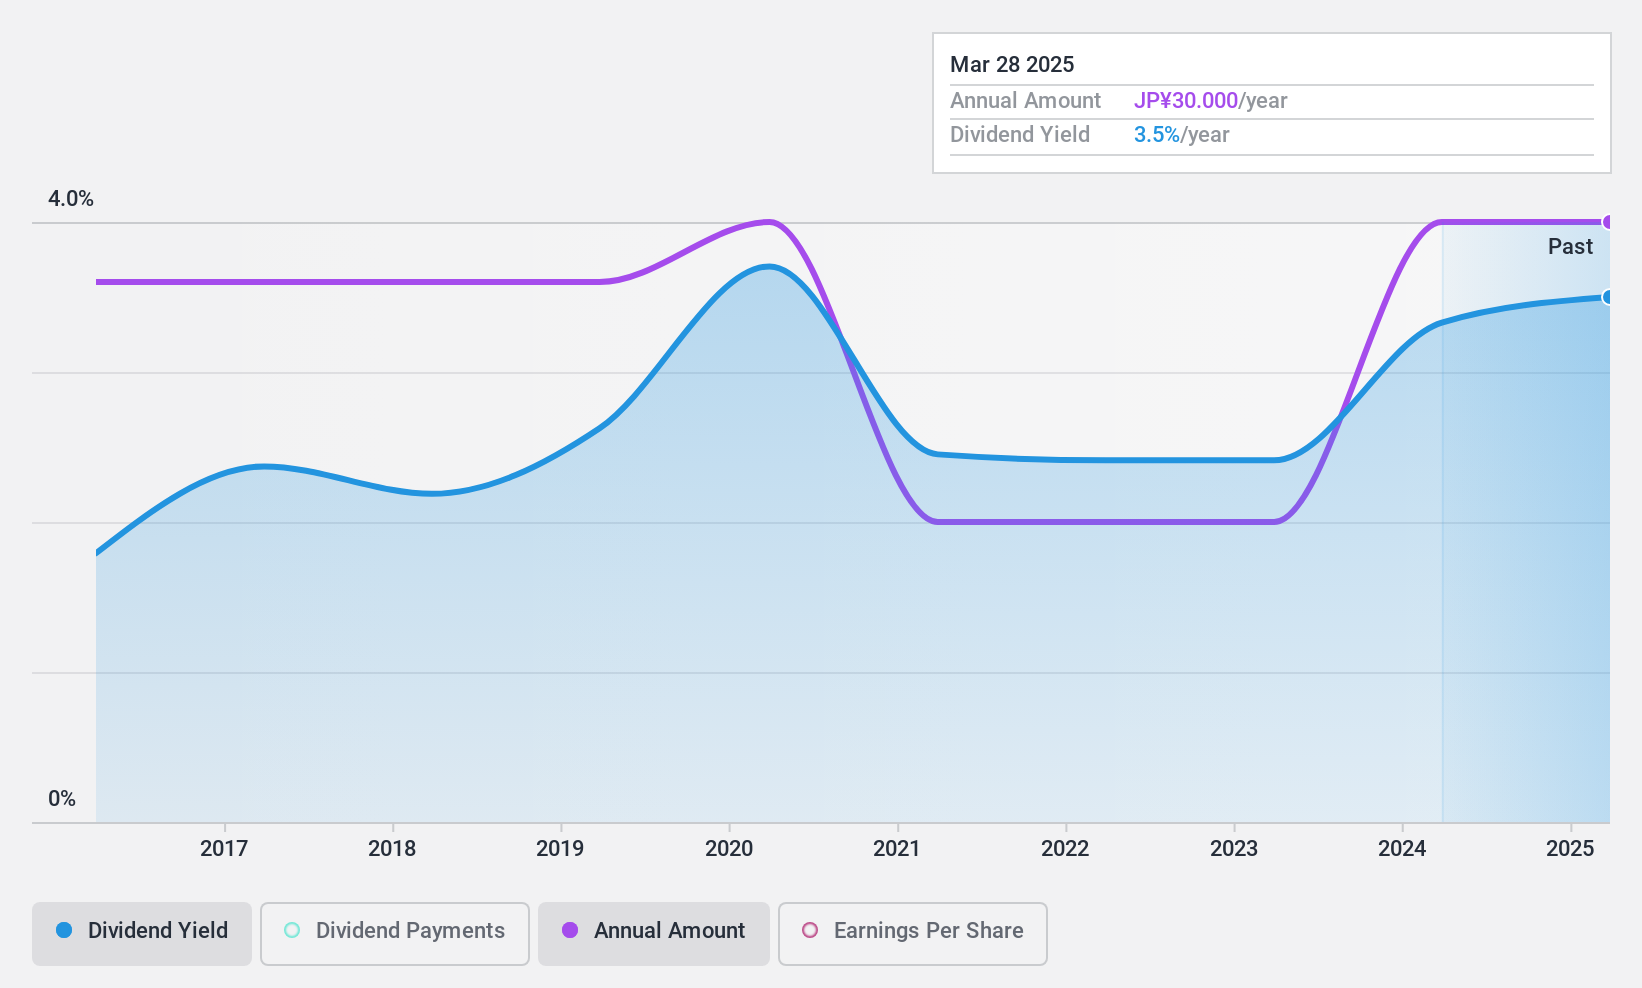
Sac's Bar Holdings (TSE:9990)
Simply Wall St Dividend Rating: ★★★★★☆
Overview: Sac's Bar Holdings Inc. operates in Japan, retailing bags, fashion goods, and related accessories with a market cap of ¥22.46 billion.
Operations: Sac's Bar Holdings Inc. generates revenue primarily from the retail sale of bags, fashion goods, and related accessories in Japan.
Dividend Yield: 3.9%
Sac's Bar Holdings has affirmed its dividend guidance for the fiscal year ending March 31, 2025, maintaining a dividend of ¥30 per share. The company projects net sales of ¥53.65 billion and profit attributable to owners of the parent at ¥2.46 billion or ¥84.52 per share for the year. Despite a volatile dividend history with annual drops over 20%, current dividends are well-covered by earnings (payout ratio: 35.1%) and cash flows (cash payout ratio: 19.1%).
- Dive into the specifics of Sac's Bar Holdings here with our thorough dividend report.
- The analysis detailed in our Sac's Bar Holdings valuation report hints at an deflated share price compared to its estimated value.
Key Takeaways
- Delve into our full catalog of 576 Top Japanese Dividend Stocks here.
- Have a stake in these businesses? Integrate your holdings into Simply Wall St's portfolio for notifications and detailed stock reports.
- Simply Wall St is a revolutionary app designed for long-term stock investors, it's free and covers every market in the world.
Looking For Alternative Opportunities?
- Explore high-performing small cap companies that haven't yet garnered significant analyst attention.
- Fuel your portfolio with companies showing strong growth potential, backed by optimistic outlooks both from analysts and management.
- Find companies with promising cash flow potential yet trading below their fair value.
This article by Simply Wall St is general in nature. We provide commentary based on historical data and analyst forecasts only using an unbiased methodology and our articles are not intended to be financial advice. It does not constitute a recommendation to buy or sell any stock, and does not take account of your objectives, or your financial situation. We aim to bring you long-term focused analysis driven by fundamental data. Note that our analysis may not factor in the latest price-sensitive company announcements or qualitative material. Simply Wall St has no position in any stocks mentioned.
Valuation is complex, but we're here to simplify it.
Discover if Nicca ChemicalLtd might be undervalued or overvalued with our detailed analysis, featuring fair value estimates, potential risks, dividends, insider trades, and its financial condition.
Access Free AnalysisHave feedback on this article? Concerned about the content? Get in touch with us directly. Alternatively, email editorial-team@simplywallst.com
About TSE:4463
Nicca ChemicalLtd
Manufactures and sells surfactants for textile chemicals, metals, pulp and paper, paints, dyes, synthetic resins, and dry cleaning and professional cleaning agents in Japan and internationally.
Flawless balance sheet with solid track record and pays a dividend.
