Zeon (TSE:4205) stock has shown steady momentum recently, gaining nearly 5% over the past week. Investors are watching closely as the company's fundamentals remain in focus and are prompting questions about what might drive future performance.
Momentum appears to be building for Zeon, with the stock now up nearly 15% year-to-date on a share price basis and a notable 24% total shareholder return over the past year. This uptick suggests optimism is returning, especially as the company navigates a changing landscape and investors look for clarity on long-term value.
After such a strong run, investors are left to wonder if Zeon's current valuation leaves room for further upside, or if the market has already factored in the company’s growth prospects. Could this be a real buying opportunity?
Advertisement
Price-to-Earnings of 9x: Is it justified?
Zeon shares are trading at a price-to-earnings (P/E) ratio of 9x, which makes the stock look undervalued compared to both its industry peers and the broader market. With a last close of ¥1,692, the stock is priced well below typical valuation levels in the Japanese chemicals sector.
The price-to-earnings ratio is a widely used metric that compares a company’s current share price to its per-share earnings. For companies like Zeon, it reveals how much investors are willing to pay for each yen of current earnings. A lower P/E can indicate the market is underappreciating the company’s profit outlook, especially if compared to peers trading at higher multiples.
In Zeon's case, not only is its P/E considerably lower than the peer average of 26.6x and the Japanese chemicals industry average of 12.4x, but it is also well below the estimated fair value P/E of 12.8x. This gap suggests the market may be overlooking the company's improving margin profile and recent earnings growth performance, which could lead to a re-rating if sentiment changes. If the market adjusts closer to the fair ratio, there could be significant upside.
Another View: Discounted Cash Flow Analysis Tells a Different Story
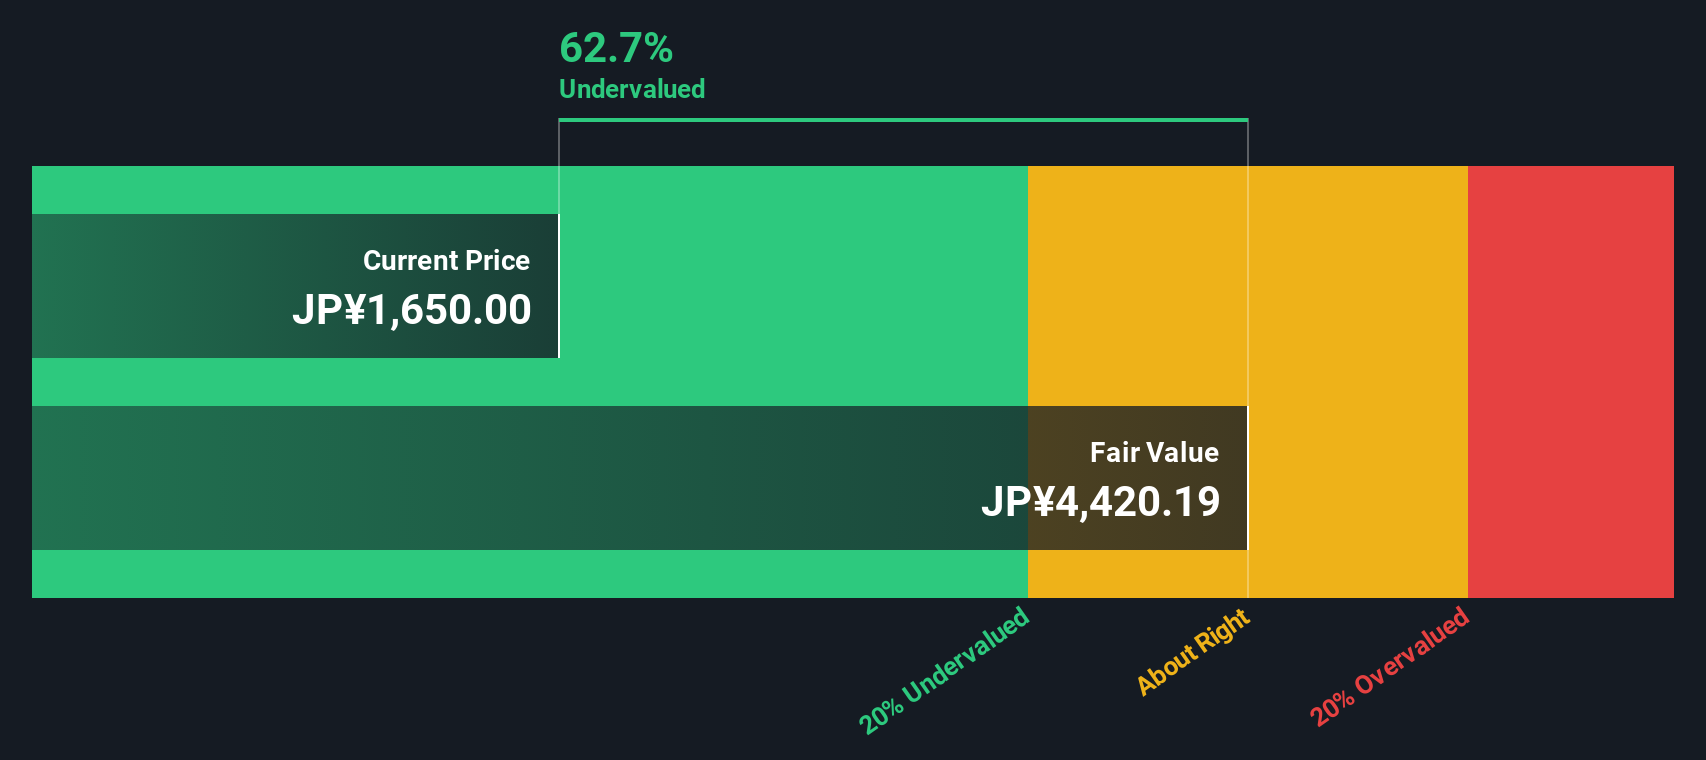
Looking at Zeon through the lens of our DCF model, the results are striking. The model estimates Zeon’s fair value at ¥4,874.5, which is around 65% above the current price. This approach suggests that the shares could be more undervalued than multiples alone indicate. However, should investors rely on this method, or is the market pricing in risks the model cannot see?
Simply Wall St performs a discounted cash flow (DCF) on every stock in the world every day (check out Zeon for example). We show the entire calculation in full. You can track the result in your watchlist or portfolio and be alerted when this changes, or use our stock screener to discover 894 undervalued stocks based on their cash flows. If you save a screener we even alert you when new companies match - so you never miss a potential opportunity.
Build Your Own Zeon Narrative
If our findings do not align with your perspective, or you prefer to dive deeper into the numbers yourself, you can shape your own view in just a few minutes, Do it your way.
Don't let the momentum stop here. Level up your strategy by tapping into stock picks others may be missing, tailored to different strengths and themes.
Get ahead of the curve by tracking these 25 AI penny stocks as they harness artificial intelligence for exceptional growth potential.
This article by Simply Wall St is general in nature. We provide commentary based on historical data
and analyst forecasts only using an unbiased methodology and our articles are not intended to be financial advice. It does not constitute a recommendation to buy or sell any stock, and does not take account of your objectives, or your
financial situation. We aim to bring you long-term focused analysis driven by fundamental data.
Note that our analysis may not factor in the latest price-sensitive company announcements or qualitative material.
Simply Wall St has no position in any stocks mentioned.
Valuation is complex, but we're here to simplify it.
Discover if Zeon might be undervalued or overvalued with our detailed analysis, featuring fair value estimates, potential risks, dividends, insider trades, and its financial condition.