
Advertisement
Take Care Before Diving Into The Deep End On Zeon Corporation (TSE:4205)
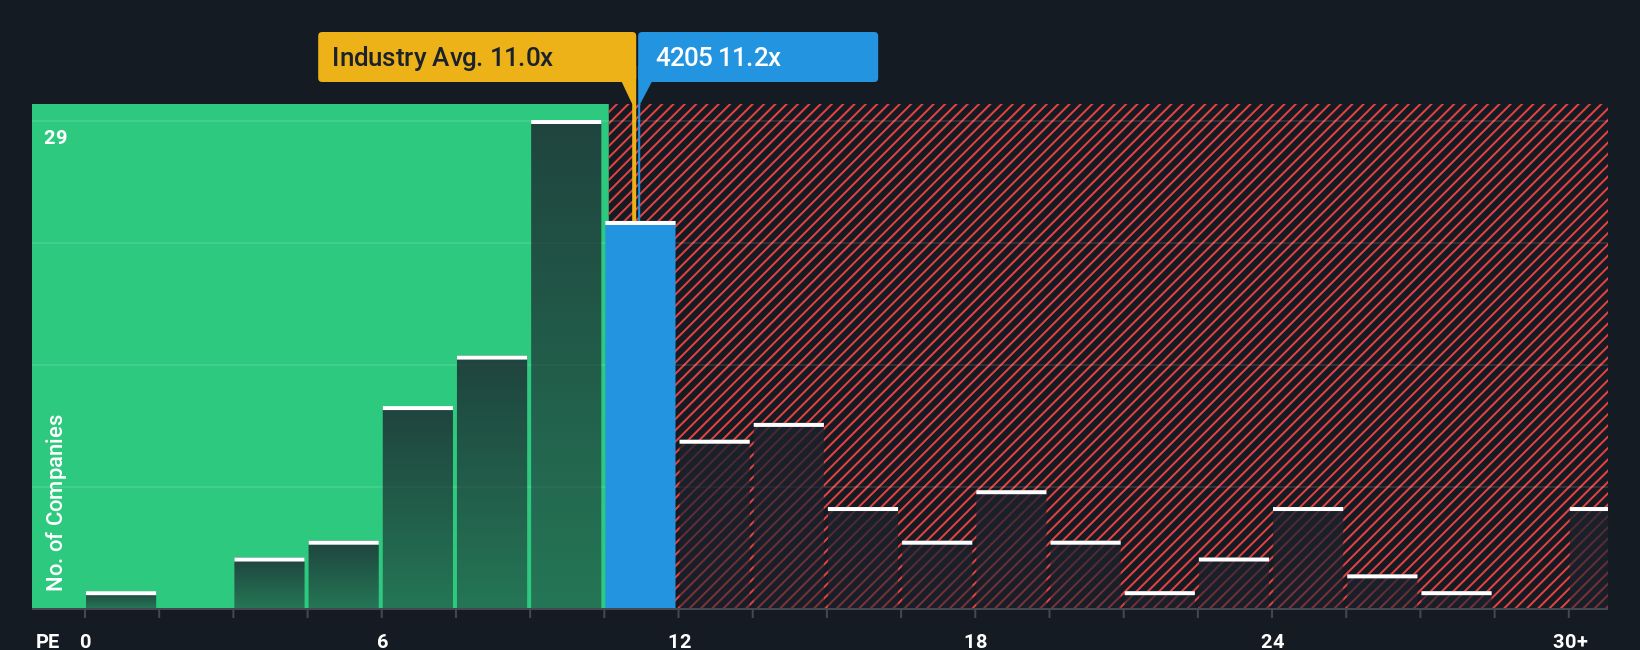
With a price-to-earnings (or "P/E") ratio of 11.2x Zeon Corporation (TSE:4205) may be sending bullish signals at the moment, given that almost half of all companies in Japan have P/E ratios greater than 14x and even P/E's higher than 22x are not unusual. Nonetheless, we'd need to dig a little deeper to determine if there is a rational basis for the reduced P/E.
Zeon could be doing better as its earnings have been going backwards lately while most other companies have been seeing positive earnings growth. It seems that many are expecting the dour earnings performance to persist, which has repressed the P/E. If you still like the company, you'd be hoping this isn't the case so that you could potentially pick up some stock while it's out of favour.
Check out our latest analysis for Zeon
Does Growth Match The Low P/E?
There's an inherent assumption that a company should underperform the market for P/E ratios like Zeon's to be considered reasonable.
If we review the last year of earnings, dishearteningly the company's profits fell to the tune of 13%. This means it has also seen a slide in earnings over the longer-term as EPS is down 13% in total over the last three years. Therefore, it's fair to say the earnings growth recently has been undesirable for the company.
Shifting to the future, estimates from the nine analysts covering the company suggest earnings should grow by 8.0% per annum over the next three years. That's shaping up to be similar to the 8.7% per annum growth forecast for the broader market.
In light of this, it's peculiar that Zeon's P/E sits below the majority of other companies. It may be that most investors are not convinced the company can achieve future growth expectations.
What We Can Learn From Zeon's P/E?
It's argued the price-to-earnings ratio is an inferior measure of value within certain industries, but it can be a powerful business sentiment indicator.
We've established that Zeon currently trades on a lower than expected P/E since its forecast growth is in line with the wider market. When we see an average earnings outlook with market-like growth, we assume potential risks are what might be placing pressure on the P/E ratio. At least the risk of a price drop looks to be subdued, but investors seem to think future earnings could see some volatility.
You should always think about risks. Case in point, we've spotted 1 warning sign for Zeon you should be aware of.
Of course, you might find a fantastic investment by looking at a few good candidates. So take a peek at this free list of companies with a strong growth track record, trading on a low P/E.
Valuation is complex, but we're here to simplify it.
Discover if Zeon might be undervalued or overvalued with our detailed analysis, featuring fair value estimates, potential risks, dividends, insider trades, and its financial condition.
Access Free AnalysisHave feedback on this article? Concerned about the content? Get in touch with us directly. Alternatively, email editorial-team (at) simplywallst.com.
This article by Simply Wall St is general in nature. We provide commentary based on historical data and analyst forecasts only using an unbiased methodology and our articles are not intended to be financial advice. It does not constitute a recommendation to buy or sell any stock, and does not take account of your objectives, or your financial situation. We aim to bring you long-term focused analysis driven by fundamental data. Note that our analysis may not factor in the latest price-sensitive company announcements or qualitative material. Simply Wall St has no position in any stocks mentioned.
About TSE:4205
Zeon
Engages in the elastomer materials, specialty materials, and other businesses in Japan, North America, Europe, and Asia.
Flawless balance sheet, undervalued and pays a dividend.
Similar Companies
Market Insights

Advertisement
Community Narratives
Kodiak AI - a potential 100 bagger opportunity?
Fair Value US$14.00|41.9% undervalued
DA
Community Contributor
A Fair Price for a Great Business Facing Real Threats
Fair Value US$383.06|14.1% undervalued
IM
Community Contributor
AXON And Shopify Integration Will Unlock Global Mobile Advertising
Fair Value US$613.59|1.3% undervalued
AN
Based on Analyst Price Targets