
Advertisement
Legendary fund manager Li Lu (who Charlie Munger backed) once said, 'The biggest investment risk is not the volatility of prices, but whether you will suffer a permanent loss of capital.' When we think about how risky a company is, we always like to look at its use of debt, since debt overload can lead to ruin. We can see that SE Corporation (TYO:3423) does use debt in its business. But the real question is whether this debt is making the company risky.
Why Does Debt Bring Risk?
Debt assists a business until the business has trouble paying it off, either with new capital or with free cash flow. If things get really bad, the lenders can take control of the business. However, a more usual (but still expensive) situation is where a company must dilute shareholders at a cheap share price simply to get debt under control. Of course, plenty of companies use debt to fund growth, without any negative consequences. The first step when considering a company's debt levels is to consider its cash and debt together.
See our latest analysis for SE
What Is SE's Debt?
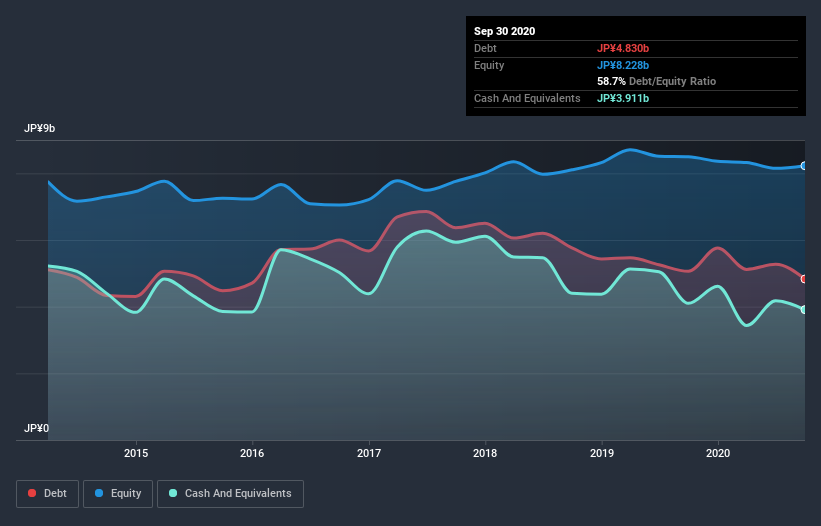
The image below, which you can click on for greater detail, shows that SE had debt of JP¥4.48b at the end of September 2020, a reduction from JP¥5.06b over a year. However, it does have JP¥3.91b in cash offsetting this, leading to net debt of about JP¥568.0m.
How Healthy Is SE's Balance Sheet?
According to the last reported balance sheet, SE had liabilities of JP¥8.52b due within 12 months, and liabilities of JP¥4.58b due beyond 12 months. Offsetting this, it had JP¥3.91b in cash and JP¥6.70b in receivables that were due within 12 months. So its liabilities outweigh the sum of its cash and (near-term) receivables by JP¥2.49b.
While this might seem like a lot, it is not so bad since SE has a market capitalization of JP¥8.52b, and so it could probably strengthen its balance sheet by raising capital if it needed to. However, it is still worthwhile taking a close look at its ability to pay off debt.
We use two main ratios to inform us about debt levels relative to earnings. The first is net debt divided by earnings before interest, tax, depreciation, and amortization (EBITDA), while the second is how many times its earnings before interest and tax (EBIT) covers its interest expense (or its interest cover, for short). This way, we consider both the absolute quantum of the debt, as well as the interest rates paid on it.
SE's net debt is only 0.36 times its EBITDA. And its EBIT covers its interest expense a whopping 40.2 times over. So we're pretty relaxed about its super-conservative use of debt. On the other hand, SE's EBIT dived 17%, over the last year. We think hat kind of performance, if repeated frequently, could well lead to difficulties for the stock. There's no doubt that we learn most about debt from the balance sheet. But you can't view debt in total isolation; since SE will need earnings to service that debt. So if you're keen to discover more about its earnings, it might be worth checking out this graph of its long term earnings trend.
Finally, a business needs free cash flow to pay off debt; accounting profits just don't cut it. So the logical step is to look at the proportion of that EBIT that is matched by actual free cash flow. In the last three years, SE's free cash flow amounted to 34% of its EBIT, less than we'd expect. That's not great, when it comes to paying down debt.
Our View
We feel some trepidation about SE's difficulty EBIT growth rate, but we've got positives to focus on, too. To wit both its interest cover and net debt to EBITDA were encouraging signs. Looking at all the angles mentioned above, it does seem to us that SE is a somewhat risky investment as a result of its debt. That's not necessarily a bad thing, since leverage can boost returns on equity, but it is something to be aware of. There's no doubt that we learn most about debt from the balance sheet. But ultimately, every company can contain risks that exist outside of the balance sheet. For example, we've discovered 5 warning signs for SE that you should be aware of before investing here.
If you're interested in investing in businesses that can grow profits without the burden of debt, then check out this free list of growing businesses that have net cash on the balance sheet.
If you decide to trade SE, use the lowest-cost* platform that is rated #1 Overall by Barron’s, Interactive Brokers. Trade stocks, options, futures, forex, bonds and funds on 135 markets, all from a single integrated account. Promoted
New: Manage All Your Stock Portfolios in One Place
We've created the ultimate portfolio companion for stock investors, and it's free.
• Connect an unlimited number of Portfolios and see your total in one currency
• Be alerted to new Warning Signs or Risks via email or mobile
• Track the Fair Value of your stocks
This article by Simply Wall St is general in nature. It does not constitute a recommendation to buy or sell any stock, and does not take account of your objectives, or your financial situation. We aim to bring you long-term focused analysis driven by fundamental data. Note that our analysis may not factor in the latest price-sensitive company announcements or qualitative material. Simply Wall St has no position in any stocks mentioned.
*Interactive Brokers Rated Lowest Cost Broker by StockBrokers.com Annual Online Review 2020
Have feedback on this article? Concerned about the content? Get in touch with us directly. Alternatively, email editorial-team (at) simplywallst.com.
About TSE:3423
SE
Engages in construction material and equipment business in Japan and internationally.
Flawless balance sheet average dividend payer.
Market Insights

Advertisement
Community Narratives
MINISO's fair value is projected at 26.69 with an anticipated PE ratio shift of 20x
Fair Value US$24.03|11.4% undervalued
BE
Community Contributor
Procter & Gamble: A Dividend Giant Facing Slowing Growth
Fair Value US$119.81|23.5% overvalued
AN
Community Contributor
Eli Lilly's Future Growth Driven by Tirzepatide and Favorable Market Conditions
Fair Value US$1.19k|14.0% undervalued
EA
Community Contributor