Advertisement
Lifenet Insurance (TSE:7157) Valuation in Focus Following Management Push for Efficiency and Corporate Value

Simply Wall St
Reviewed by Kshitija Bhandaru
Lifenet Insurance (TSE:7157) is drawing investor interest after its Board of Directors discussed new initiatives to improve operational efficiency and strategies to enhance corporate value. These efforts highlight management's focus on stock price and market positioning.
See our latest analysis for Lifenet Insurance.
Shares of Lifenet Insurance have shown modest activity lately, with the 1-year total shareholder return sitting just above break-even. Momentum is still building. These fresh strategic moves could spark renewed interest from the market as investors watch for results.
If Lifenet’s management shifts have you wondering what else is brewing in the market, now is the perfect time to broaden your search and discover fast growing stocks with high insider ownership
With Lifenet posting steady earnings growth and trading at a modest discount to analyst price targets, the key question now is whether this signals an overlooked buying opportunity or if the market has already accounted for future gains.
Price-to-Earnings of 26.2x: Is it justified?
Lifenet Insurance is currently valued at a price-to-earnings (P/E) ratio of 26.2x, much higher than typical benchmarks set by its peers. Its recent close at ¥2,048 positions it well above comparable sector averages, suggesting shares are trading at a premium multiple.
The price-to-earnings ratio measures how much investors are willing to pay for each yen of earnings, making it a crucial yardstick for the insurance sector, where steady profits are prized. In this context, a higher P/E can indicate the market expects strong future growth or sees unique value in the company’s prospects.
However, Lifenet's P/E ratio not only exceeds the Asian insurance industry average (11.8x), but it is also more than double the peer average (11.9x) and sits significantly above what is considered a "fair" P/E based on fundamental regression analysis (12.6x). This premium may reflect optimism about earnings stability or growth, but the market could reconsider if future results do not justify such high expectations.
Explore the SWS fair ratio for Lifenet Insurance
Result: Price-to-Earnings of 26.2x (OVERVALUED)
However, a slowdown in earnings growth or market sentiment could temper optimism around Lifenet’s premium valuation and shift investor attention to potential downside risks.
Find out about the key risks to this Lifenet Insurance narrative.
Another View: Discounted Cash Flow Says Shares Are Overvalued
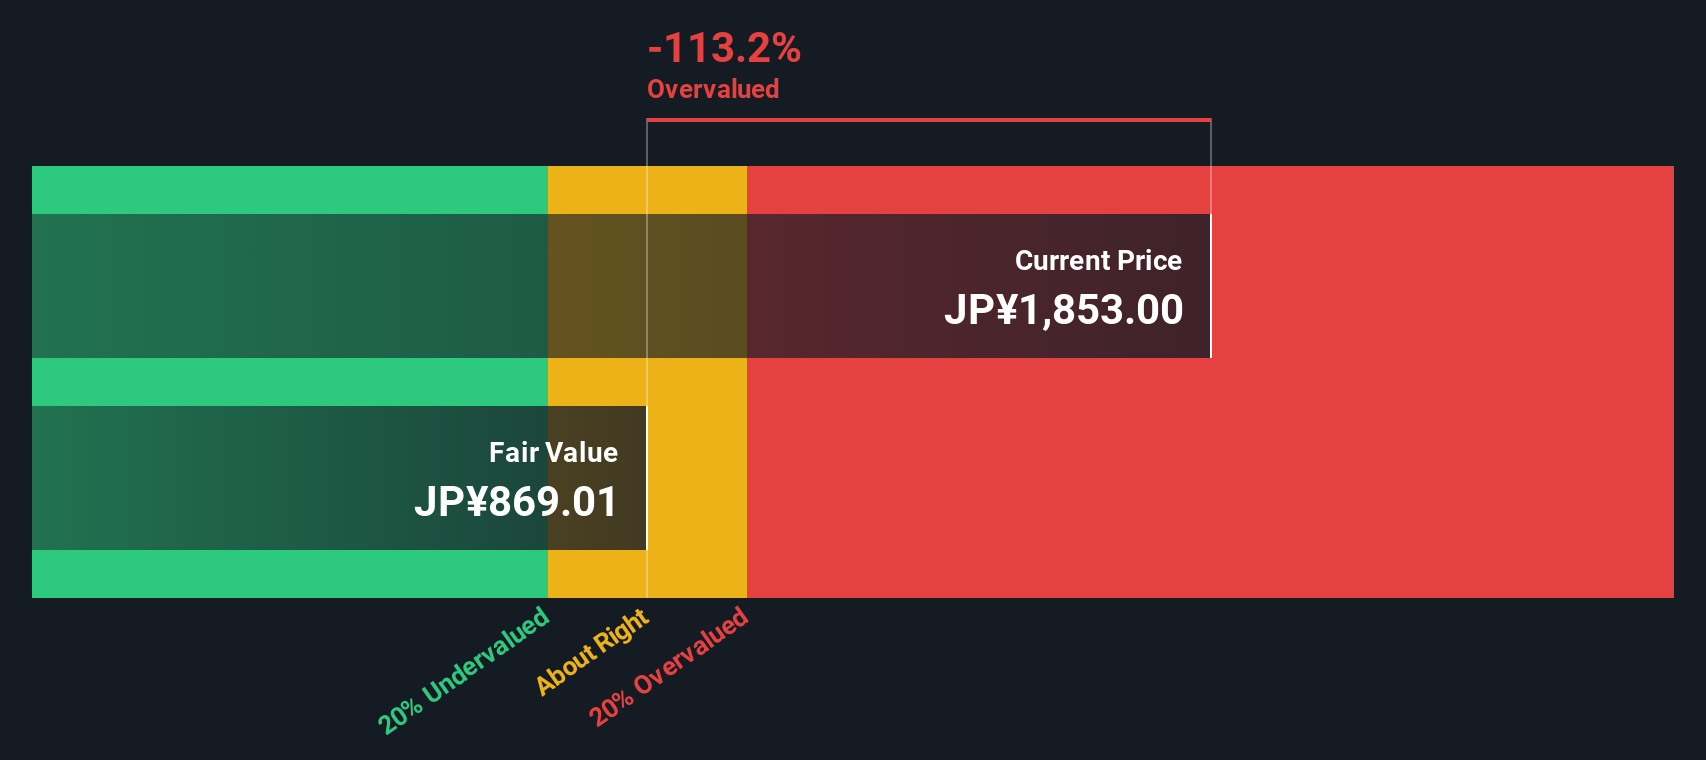
While Lifenet Insurance’s price-to-earnings ratio implies optimism, our DCF model offers a starker assessment. The SWS DCF model calculates fair value at ¥894.84 a share, which is well below today’s ¥2,048 price. This suggests significant overvaluation. Are expectations running ahead of fundamentals, or is the market seeing something more?
Look into how the SWS DCF model arrives at its fair value.
Simply Wall St performs a discounted cash flow (DCF) on every stock in the world every day (check out Lifenet Insurance for example). We show the entire calculation in full. You can track the result in your watchlist or portfolio and be alerted when this changes, or use our stock screener to discover undervalued stocks based on their cash flows. If you save a screener we even alert you when new companies match - so you never miss a potential opportunity.
Build Your Own Lifenet Insurance Narrative
If you want a different perspective or have insights of your own, you can dive into the data yourself and build a narrative in just a few minutes. Do it your way
A good starting point is our analysis highlighting 2 key rewards investors are optimistic about regarding Lifenet Insurance.
Looking for More Investment Ideas?
Don’t stick to a single stock when genuine breakthroughs could be just one step away. The smartest investors always search broadly for new opportunities.
- Unlock the potential of market underdogs by scanning for exceptional value with these 896 undervalued stocks based on cash flows that have strong cash flows and fly under the radar.
- Tap into the power of recurring income by reviewing these 19 dividend stocks with yields > 3% offering attractive yields above 3% for more stability in your portfolio.
- Stay ahead on the tech frontier by spotting innovation early with these 24 AI penny stocks leading advancements in artificial intelligence and reshaping entire industries.
This article by Simply Wall St is general in nature. We provide commentary based on historical data and analyst forecasts only using an unbiased methodology and our articles are not intended to be financial advice. It does not constitute a recommendation to buy or sell any stock, and does not take account of your objectives, or your financial situation. We aim to bring you long-term focused analysis driven by fundamental data. Note that our analysis may not factor in the latest price-sensitive company announcements or qualitative material. Simply Wall St has no position in any stocks mentioned.
New: AI Stock Screener & Alerts
Our new AI Stock Screener scans the market every day to uncover opportunities.
• Dividend Powerhouses (3%+ Yield)
• Undervalued Small Caps with Insider Buying
• High growth Tech and AI Companies
Or build your own from over 50 metrics.
Have feedback on this article? Concerned about the content? Get in touch with us directly. Alternatively, email editorial-team@simplywallst.com
About TSE:7157
Lifenet Insurance
Provides life insurance products and services in Japan.
Excellent balance sheet with limited growth.
Market Insights

Advertisement
Community Narratives
The company that turned a verb into a global necessity and basically runs the modern internet, digital ads, smartphones, maps, and AI.
Fair Value US$300.00|7.5% undervalued
OS
Community Contributor
Flowers Foods Pays A Fair Price For Health
Fair Value US$16.12|25.4% undervalued
NV
Community Contributor
TMX Group will thrive with 33.3% profit margin and enduring market moat
Fair Value CA$49.90|3.6% overvalued
LI
Community Contributor
The "Molecular Pencil": Why Beam's Technology is Built to Win
Fair Value US$65.01|65.0% undervalued
DA
Community Contributor