Advertisement
- Japan
- /
- Personal Products
- /
- TSE:7806
MTG (TSE:7806) Valuation Review Following Strong Net Sales and Profit Growth

Simply Wall St
Reviewed by Simply Wall St
MTG (TSE:7806) just revealed its latest results, capturing attention with a jump in net sales along with a significant increase in operating profits. Profit attributable to shareholders also soared, underscoring stronger management execution this year.
See our latest analysis for MTG.
Following these robust results, MTG’s stock has seen a remarkable run, with a 31.9% gain over the last week alone and a share price return of 142.4% year-to-date. Looking longer term, shareholders have benefited from a one-year total return of 166.7% and an impressive 306.6% over three years. This indicates that momentum is clearly accelerating.
If MTG’s breakout performance sparks your curiosity, it might be the perfect moment to broaden your search and discover fast growing stocks with high insider ownership
With such a powerful rally and remarkable financial results, the big question is whether MTG shares still have room to run, or if the current price already reflects all the future growth ahead. Could there still be a buying opportunity?
Price-to-Earnings of 24.3x: Is it justified?
MTG is trading at a price-to-earnings (P/E) ratio of 24.3x, which means the market is paying ¥24.3 for every ¥1 of the company’s earnings. With the latest close at ¥4,920, the current share price seems comparatively reasonable when aligned with peer and internal benchmarks.
The price-to-earnings ratio is a useful valuation tool, especially for consumer-focused companies like MTG. It gauges how much investors are willing to pay for each unit of profit. For MTG, a P/E of 24.3x signals that the market expects consistent profit growth or a solid earnings foundation.
This valuation stands out when compared to sector averages. MTG’s P/E ratio is better value than its peer average of 32.3x. This suggests the stock is priced more conservatively than many competitors. Compared to the Japanese Personal Products industry average of 24.2x, MTG is just slightly higher, which hints at expectations in line with sector trends. The estimated fair P/E ratio for MTG is 27.9x. This is a level the stock could potentially move towards if sentiment improves further.
Explore the SWS fair ratio for MTG
Result: Price-to-Earnings of 24.3x (UNDERVALUED)
However, shifting consumer trends or unexpected regulatory changes could challenge MTG's current momentum. These factors may impact its outlook despite recent strong performance.
Find out about the key risks to this MTG narrative.
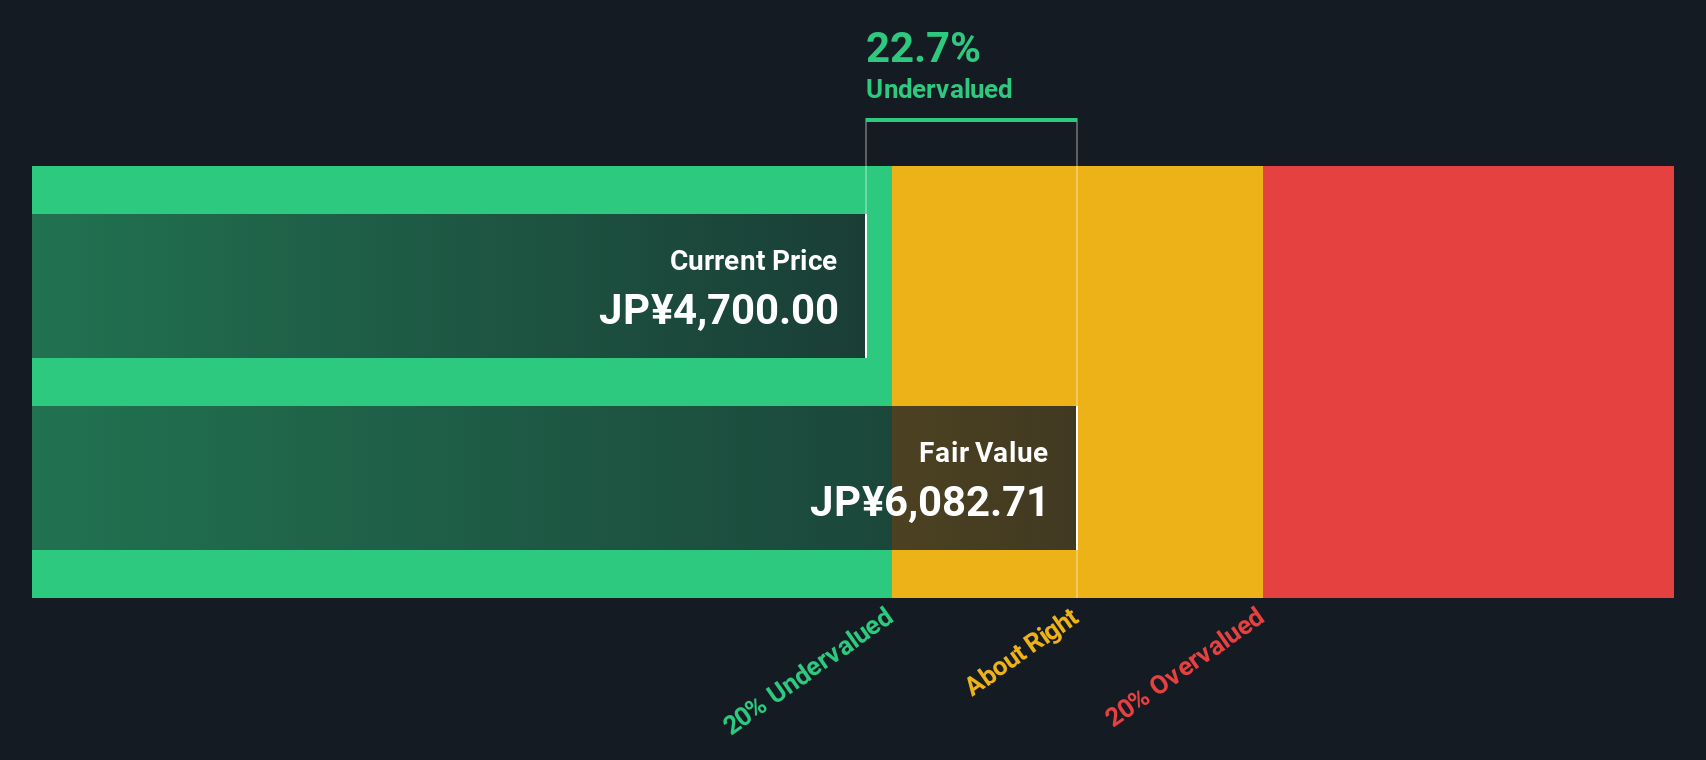
Another View: SWS DCF Model Signals More Upside
While the price-to-earnings ratio suggests MTG is fairly valued, our SWS discounted cash flow (DCF) model offers a different perspective. According to this method, MTG shares are undervalued by about 18.8%, which hints at possible upside that the market may not have fully priced in yet. Could this alternative view point to a hidden opportunity?
Look into how the SWS DCF model arrives at its fair value.
Simply Wall St performs a discounted cash flow (DCF) on every stock in the world every day (check out MTG for example). We show the entire calculation in full. You can track the result in your watchlist or portfolio and be alerted when this changes, or use our stock screener to discover 879 undervalued stocks based on their cash flows. If you save a screener we even alert you when new companies match - so you never miss a potential opportunity.
Build Your Own MTG Narrative
If you have a different take or want to dig into the numbers yourself, you can build your own perspective from scratch in just a few minutes. Do it your way
A great starting point for your MTG research is our analysis highlighting 3 key rewards and 1 important warning sign that could impact your investment decision.
Looking for more investment ideas?
Don’t stop at MTG. If you want to stay ahead and spot timely opportunities, now is the perfect moment to check out fresh investment ideas from Simply Wall St’s powerful screener tools.
- Tap into big payout potential and secure your income with these 16 dividend stocks with yields > 3%, offering attractive yields above 3%.
- Ride the momentum in artificial intelligence by searching for these 25 AI penny stocks that may benefit from growing demand and innovation in the tech landscape.
- Get ahead of the curve by reviewing these 879 undervalued stocks based on cash flows that are currently trading beneath their estimated fair value and could offer hidden upside.
This article by Simply Wall St is general in nature. We provide commentary based on historical data and analyst forecasts only using an unbiased methodology and our articles are not intended to be financial advice. It does not constitute a recommendation to buy or sell any stock, and does not take account of your objectives, or your financial situation. We aim to bring you long-term focused analysis driven by fundamental data. Note that our analysis may not factor in the latest price-sensitive company announcements or qualitative material. Simply Wall St has no position in any stocks mentioned.
New: Manage All Your Stock Portfolios in One Place
We've created the ultimate portfolio companion for stock investors, and it's free.
• Connect an unlimited number of Portfolios and see your total in one currency
• Be alerted to new Warning Signs or Risks via email or mobile
• Track the Fair Value of your stocks
Have feedback on this article? Concerned about the content? Get in touch with us directly. Alternatively, email editorial-team@simplywallst.com
About TSE:7806
MTG
Manufactures and sells health, beauty, and wellness products in Japan and internationally.
Solid track record with excellent balance sheet.
Market Insights

Advertisement
Community Narratives
MINISO's fair value is projected at 26.69 with an anticipated PE ratio shift of 20x
Fair Value US$24.03|11.0% undervalued
BE
Community Contributor
Procter & Gamble: A Dividend Giant Facing Slowing Growth
Fair Value US$119.81|23.3% overvalued
AN
Community Contributor
Eli Lilly's Future Growth Driven by Tirzepatide and Favorable Market Conditions
Fair Value US$1.19k|13.8% undervalued
EA
Community Contributor