
Advertisement
Key Insights
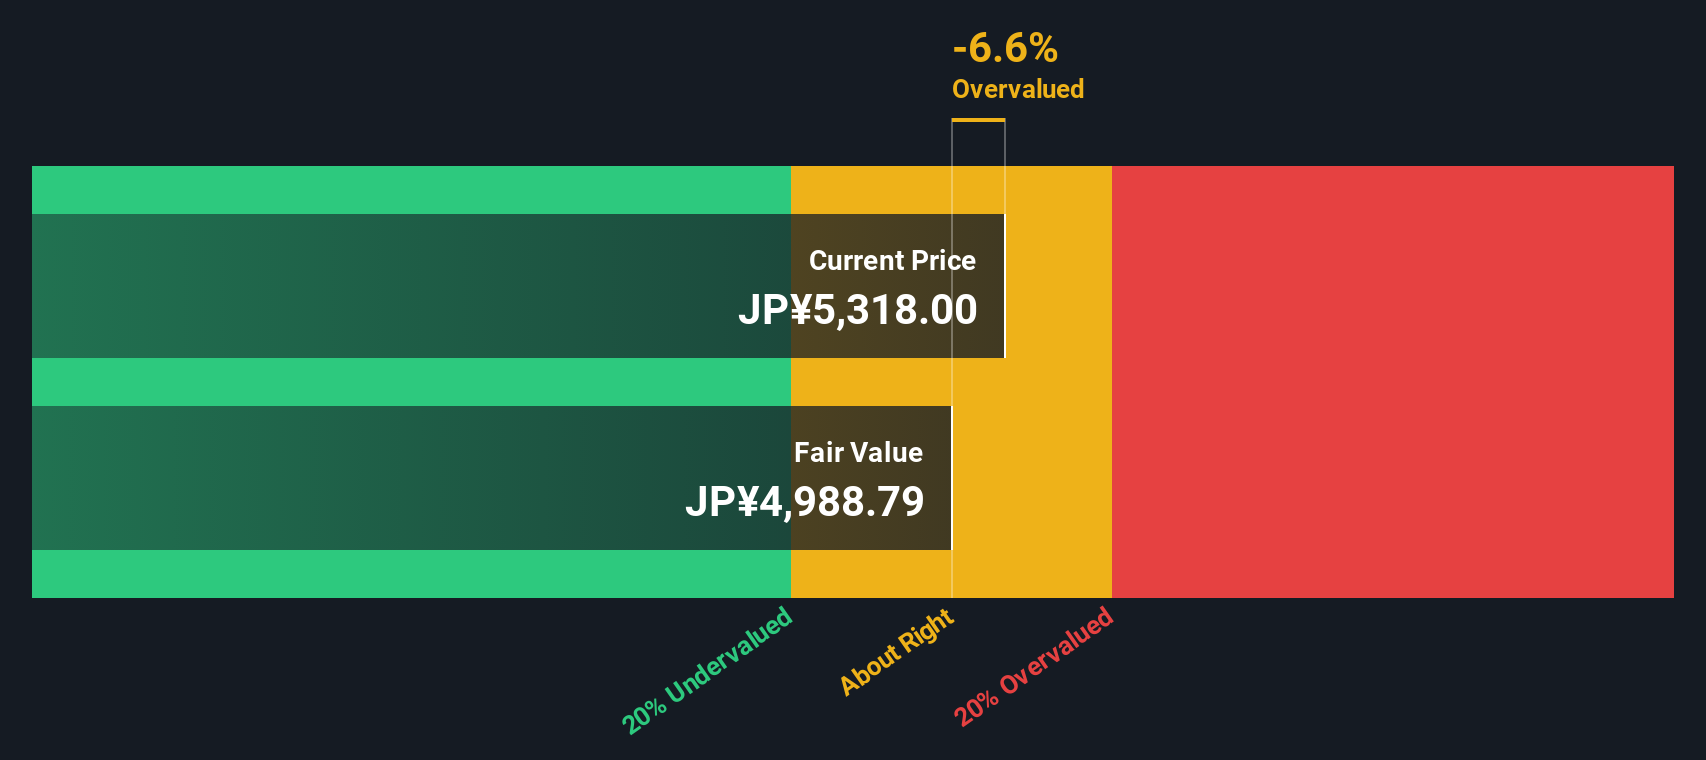
- The projected fair value for Toho Holdings is JP¥4,989 based on 2 Stage Free Cash Flow to Equity
- With JP¥5,318 share price, Toho Holdings appears to be trading close to its estimated fair value
- Our fair value estimate is 1.5% lower than Toho Holdings' analyst price target of JP¥5,067
Today we will run through one way of estimating the intrinsic value of Toho Holdings Co., Ltd. (TSE:8129) by taking the expected future cash flows and discounting them to their present value. This will be done using the Discounted Cash Flow (DCF) model. Before you think you won't be able to understand it, just read on! It's actually much less complex than you'd imagine.
Remember though, that there are many ways to estimate a company's value, and a DCF is just one method. If you want to learn more about discounted cash flow, the rationale behind this calculation can be read in detail in the Simply Wall St analysis model.
The Model
We use what is known as a 2-stage model, which simply means we have two different periods of growth rates for the company's cash flows. Generally the first stage is higher growth, and the second stage is a lower growth phase. To start off with, we need to estimate the next ten years of cash flows. Where possible we use analyst estimates, but when these aren't available we extrapolate the previous free cash flow (FCF) from the last estimate or reported value. We assume companies with shrinking free cash flow will slow their rate of shrinkage, and that companies with growing free cash flow will see their growth rate slow, over this period. We do this to reflect that growth tends to slow more in the early years than it does in later years.
Generally we assume that a dollar today is more valuable than a dollar in the future, and so the sum of these future cash flows is then discounted to today's value:
10-year free cash flow (FCF) forecast
| 2026 | 2027 | 2028 | 2029 | 2030 | 2031 | 2032 | 2033 | 2034 | 2035 | |
| Levered FCF (¥, Millions) | JP¥26.0b | JP¥15.2b | JP¥18.3b | JP¥15.8b | JP¥14.4b | JP¥13.5b | JP¥12.9b | JP¥12.5b | JP¥12.3b | JP¥12.1b |
| Growth Rate Estimate Source | Analyst x1 | Analyst x3 | Analyst x3 | Est @ -13.45% | Est @ -9.26% | Est @ -6.32% | Est @ -4.27% | Est @ -2.83% | Est @ -1.83% | Est @ -1.12% |
| Present Value (¥, Millions) Discounted @ 4.7% | JP¥24.8k | JP¥13.9k | JP¥15.9k | JP¥13.2k | JP¥11.4k | JP¥10.2k | JP¥9.3k | JP¥8.7k | JP¥8.1k | JP¥7.7k |
("Est" = FCF growth rate estimated by Simply Wall St)
Present Value of 10-year Cash Flow (PVCF) = JP¥123b
After calculating the present value of future cash flows in the initial 10-year period, we need to calculate the Terminal Value, which accounts for all future cash flows beyond the first stage. The Gordon Growth formula is used to calculate Terminal Value at a future annual growth rate equal to the 5-year average of the 10-year government bond yield of 0.5%. We discount the terminal cash flows to today's value at a cost of equity of 4.7%.
Terminal Value (TV)= FCF2035 × (1 + g) ÷ (r – g) = JP¥12b× (1 + 0.5%) ÷ (4.7%– 0.5%) = JP¥291b
Present Value of Terminal Value (PVTV)= TV / (1 + r)10= JP¥291b÷ ( 1 + 4.7%)10= JP¥183b
The total value, or equity value, is then the sum of the present value of the future cash flows, which in this case is JP¥306b. In the final step we divide the equity value by the number of shares outstanding. Relative to the current share price of JP¥5.3k, the company appears around fair value at the time of writing. The assumptions in any calculation have a big impact on the valuation, so it is better to view this as a rough estimate, not precise down to the last cent.
The Assumptions
We would point out that the most important inputs to a discounted cash flow are the discount rate and of course the actual cash flows. You don't have to agree with these inputs, I recommend redoing the calculations yourself and playing with them. The DCF also does not consider the possible cyclicality of an industry, or a company's future capital requirements, so it does not give a full picture of a company's potential performance. Given that we are looking at Toho Holdings as potential shareholders, the cost of equity is used as the discount rate, rather than the cost of capital (or weighted average cost of capital, WACC) which accounts for debt. In this calculation we've used 4.7%, which is based on a levered beta of 0.800. Beta is a measure of a stock's volatility, compared to the market as a whole. We get our beta from the industry average beta of globally comparable companies, with an imposed limit between 0.8 and 2.0, which is a reasonable range for a stable business.
View our latest analysis for Toho Holdings
SWOT Analysis for Toho Holdings
Strength
- Debt is well covered by earnings.
Weakness
- Earnings growth over the past year underperformed the Healthcare industry.
- Dividend is low compared to the top 25% of dividend payers in the Healthcare market.
Opportunity
- Annual earnings are forecast to grow for the next 3 years.
- Good value based on P/E ratio compared to estimated Fair P/E ratio.
Threat
- Debt is not well covered by operating cash flow.
- Paying a dividend but company has no free cash flows.
- Annual earnings are forecast to grow slower than the Japanese market.
Next Steps:
Whilst important, the DCF calculation ideally won't be the sole piece of analysis you scrutinize for a company. The DCF model is not a perfect stock valuation tool. Rather it should be seen as a guide to "what assumptions need to be true for this stock to be under/overvalued?" If a company grows at a different rate, or if its cost of equity or risk free rate changes sharply, the output can look very different. For Toho Holdings, we've put together three pertinent factors you should further research:
- Risks: Consider for instance, the ever-present spectre of investment risk. We've identified 1 warning sign with Toho Holdings , and understanding it should be part of your investment process.
- Future Earnings: How does 8129's growth rate compare to its peers and the wider market? Dig deeper into the analyst consensus number for the upcoming years by interacting with our free analyst growth expectation chart.
- Other Solid Businesses: Low debt, high returns on equity and good past performance are fundamental to a strong business. Why not explore our interactive list of stocks with solid business fundamentals to see if there are other companies you may not have considered!
PS. The Simply Wall St app conducts a discounted cash flow valuation for every stock on the TSE every day. If you want to find the calculation for other stocks just search here.
Valuation is complex, but we're here to simplify it.
Discover if Toho Holdings might be undervalued or overvalued with our detailed analysis, featuring fair value estimates, potential risks, dividends, insider trades, and its financial condition.
Access Free AnalysisHave feedback on this article? Concerned about the content? Get in touch with us directly. Alternatively, email editorial-team (at) simplywallst.com.
This article by Simply Wall St is general in nature. We provide commentary based on historical data and analyst forecasts only using an unbiased methodology and our articles are not intended to be financial advice. It does not constitute a recommendation to buy or sell any stock, and does not take account of your objectives, or your financial situation. We aim to bring you long-term focused analysis driven by fundamental data. Note that our analysis may not factor in the latest price-sensitive company announcements or qualitative material. Simply Wall St has no position in any stocks mentioned.
About TSE:8129
Toho Holdings
Engages in the wholesale distribution of pharmaceutical products in Japan.
Flawless balance sheet and undervalued.
Market Insights

Advertisement
Community Narratives
MINISO's fair value is projected at 26.69 with an anticipated PE ratio shift of 20x
Fair Value US$24.03|11.0% undervalued
BE
Community Contributor
Procter & Gamble: A Dividend Giant Facing Slowing Growth
Fair Value US$119.81|23.3% overvalued
AN
Community Contributor
Eli Lilly's Future Growth Driven by Tirzepatide and Favorable Market Conditions
Fair Value US$1.19k|13.8% undervalued
EA
Community Contributor