Advertisement
- Japan
- /
- Medical Equipment
- /
- TSE:6960
Fukuda Denshi (TSE:6960): Assessing Valuation After New Earnings Guidance and Higher Interim Dividend

Simply Wall St
Reviewed by Simply Wall St
Fukuda Denshi (TSE:6960) released its earnings outlook for the fiscal year ending March 2026, together with news of a higher interim dividend. These updates offer investors clearer signals on management’s current expectations and commitment to shareholder returns.
See our latest analysis for Fukuda Denshi.
Fukuda Denshi’s updated earnings guidance and higher interim dividend have brought renewed attention to the stock, with investors weighing the company’s growth signals against recent results. While the share price is at ¥7,000, the 1-year total shareholder return has been nearly flat. Still, strong three- and five-year total returns of 65% and 118% show impressive long-term momentum remains intact. The latest announcements may signal renewed confidence from management.
If these recent moves have you wondering what else is gaining ground in healthcare, it’s a perfect moment to discover See the full list for free.
With new guidance and dividends now in focus, the key question remains: is Fukuda Denshi undervalued at current levels, or has the market already priced in its next phase of growth, leaving little room for upside?
Price-to-Earnings of 10.3x: Is it justified?
Fukuda Denshi trades at a price-to-earnings (P/E) ratio of 10.3x as of the latest close at ¥7,000, signaling an undervalued status compared to key benchmarks and peers.
The price-to-earnings ratio measures how much investors are paying for each unit of earnings. A lower ratio can indicate undervaluation if the company’s future earning potential remains strong, especially in the healthcare technology space where growth and margins matter.
For Fukuda Denshi, the 10.3x P/E is far lower than the estimated fair P/E ratio of 17.9x and the JP Medical Equipment industry average of 15.8x. Compared to the peer average of 20.6x, the company appears distinctly inexpensive. This suggests the market could be underpricing the company’s consistent historical earnings growth and unique sector position. If the fair ratio becomes a target, there could be a significant upward re-rating in store.
Explore the SWS fair ratio for Fukuda Denshi
Result: Price-to-Earnings of 10.3x (UNDERVALUED)
However, slower annual revenue growth and a modest year-to-date share price decline could challenge the current undervaluation story if these trends persist.
Find out about the key risks to this Fukuda Denshi narrative.
Another View: What Does Our DCF Model Indicate?
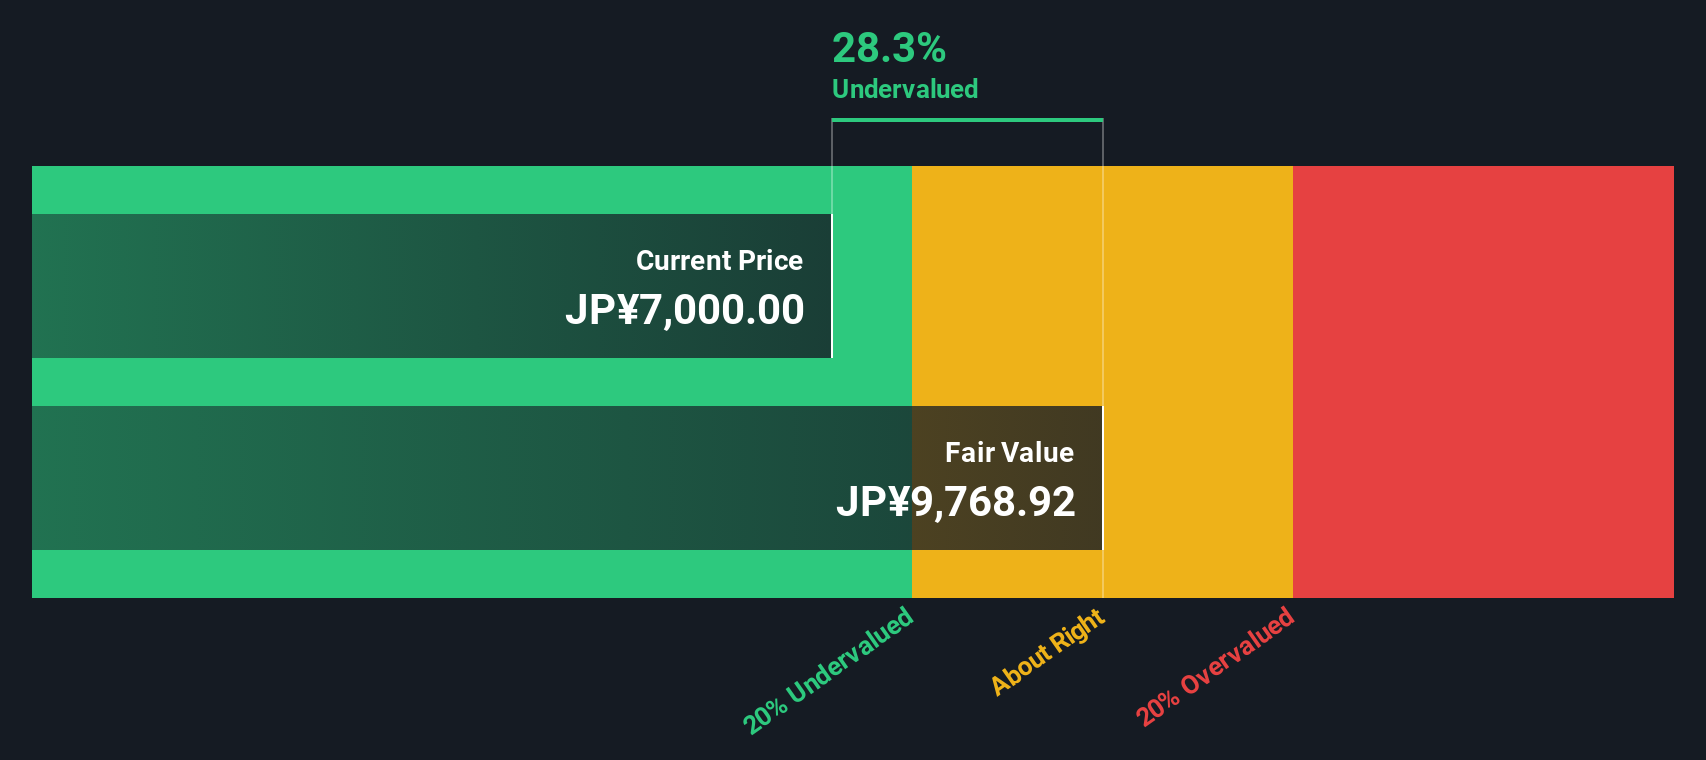
Looking at Fukuda Denshi through the lens of the SWS DCF model offers a different perspective. The DCF suggests shares are trading around 28% below their fair value, which reinforces the notion that the stock could be significantly undervalued. However, does this discount truly reflect reality or does it overlook subtle risks ahead?
Look into how the SWS DCF model arrives at its fair value.
Simply Wall St performs a discounted cash flow (DCF) on every stock in the world every day (check out Fukuda Denshi for example). We show the entire calculation in full. You can track the result in your watchlist or portfolio and be alerted when this changes, or use our stock screener to discover 924 undervalued stocks based on their cash flows. If you save a screener we even alert you when new companies match - so you never miss a potential opportunity.
Build Your Own Fukuda Denshi Narrative
If our assessment does not match your outlook or you are keen to dive deeper into the details, you can quickly build your own narrative in just a few minutes. Do it your way
A great starting point for your Fukuda Denshi research is our analysis highlighting 4 key rewards and 1 important warning sign that could impact your investment decision.
Looking for more investment ideas?
Keep your investment edge sharp by tapping into hidden gems with high potential. Don’t miss out on opportunities outside the obvious; your next big winner could be just a click away.
- Capture strong yields and reliable income streams when you check out these 17 dividend stocks with yields > 3% offering impressive payouts and solid fundamentals.
- Spot emerging leaders in artificial intelligence by reviewing these 25 AI penny stocks shaping the next wave of innovation across multiple sectors.
- Find undervalued stocks with robust cash flows by starting your search with these 924 undervalued stocks based on cash flows and staying ahead of the curve.
This article by Simply Wall St is general in nature. We provide commentary based on historical data and analyst forecasts only using an unbiased methodology and our articles are not intended to be financial advice. It does not constitute a recommendation to buy or sell any stock, and does not take account of your objectives, or your financial situation. We aim to bring you long-term focused analysis driven by fundamental data. Note that our analysis may not factor in the latest price-sensitive company announcements or qualitative material. Simply Wall St has no position in any stocks mentioned.
New: AI Stock Screener & Alerts
Our new AI Stock Screener scans the market every day to uncover opportunities.
• Dividend Powerhouses (3%+ Yield)
• Undervalued Small Caps with Insider Buying
• High growth Tech and AI Companies
Or build your own from over 50 metrics.
Have feedback on this article? Concerned about the content? Get in touch with us directly. Alternatively, email editorial-team@simplywallst.com
About TSE:6960
Fukuda Denshi
Engages in the manufacture and sale of medical instruments in Japan and internationally.
Flawless balance sheet, undervalued and pays a dividend.
Market Insights

Advertisement
Community Narratives
MicroVision will explode future revenue by 380.37% with a vision towards success
Fair Value US$60.00|98.4% undervalued
TH
Community Contributor
The Indispensable Artery for a New North American Economy
Fair Value CA$132.87|1.3% undervalued
TI
Community Contributor