- Japan
- /
- Healthtech
- /
- TSE:2413
Is M3 (TSE:2413) Overvalued After Recent Share Price Rebound? A Closer Look at the Current Valuation

Reviewed by Kshitija Bhandaru
M3 (TSE:2413) shares have caught the attention of investors lately, with some shifts in performance over the past month. Many are now weighing recent trends against broader financial results to find clues about what’s next for the stock.
See our latest analysis for M3.
M3’s share price has regained momentum in recent months, climbing over 23% in the past quarter and nearly 68% so far this year. However, the one-year total shareholder return of 34% still trails long-term highs from earlier periods. Recent price moves suggest shifting sentiment as investors revisit the company’s growth potential following earlier volatility.
If you’re watching how investor trends change in fast-moving markets, now’s a great time to broaden your search and discover See the full list for free.
But with M3’s strong recent rebound and ongoing earnings growth, the question remains: Are shares still undervalued, or has the market already factored in all the company’s future potential? Is this a genuine buying opportunity?
Price-to-Earnings of 37.8x: Is it justified?
With M3 trading at a price-to-earnings (P/E) ratio of 37.8x, the stock appears richly valued compared to peers and broader market averages given its recent close at ¥2,302 per share.
The price-to-earnings ratio reflects how much investors are currently willing to pay for each yen of annual earnings. For M3’s sector, this is a crucial measure because it compares the stock’s valuation with both historical levels and other healthcare service providers.
M3’s P/E is noticeably higher than that of the average Asian Healthcare Services company, which sits at 25.9x, and above the peer average of 28.8x. This suggests that investors are pricing in strong growth or a premium for M3’s business model. However, when compared to the estimated “fair” P/E ratio for the company of 36.6x, the premium narrows, hinting that the market may be balancing near-term optimism with more moderate future expectations.
Explore the SWS fair ratio for M3
Result: Price-to-Earnings of 37.8x (OVERVALUED)
However, weaker long-term returns and a high valuation could limit upside if revenue or earnings growth slows unexpectedly in coming quarters.
Find out about the key risks to this M3 narrative.
Another View: Discounted Cash Flow Perspective
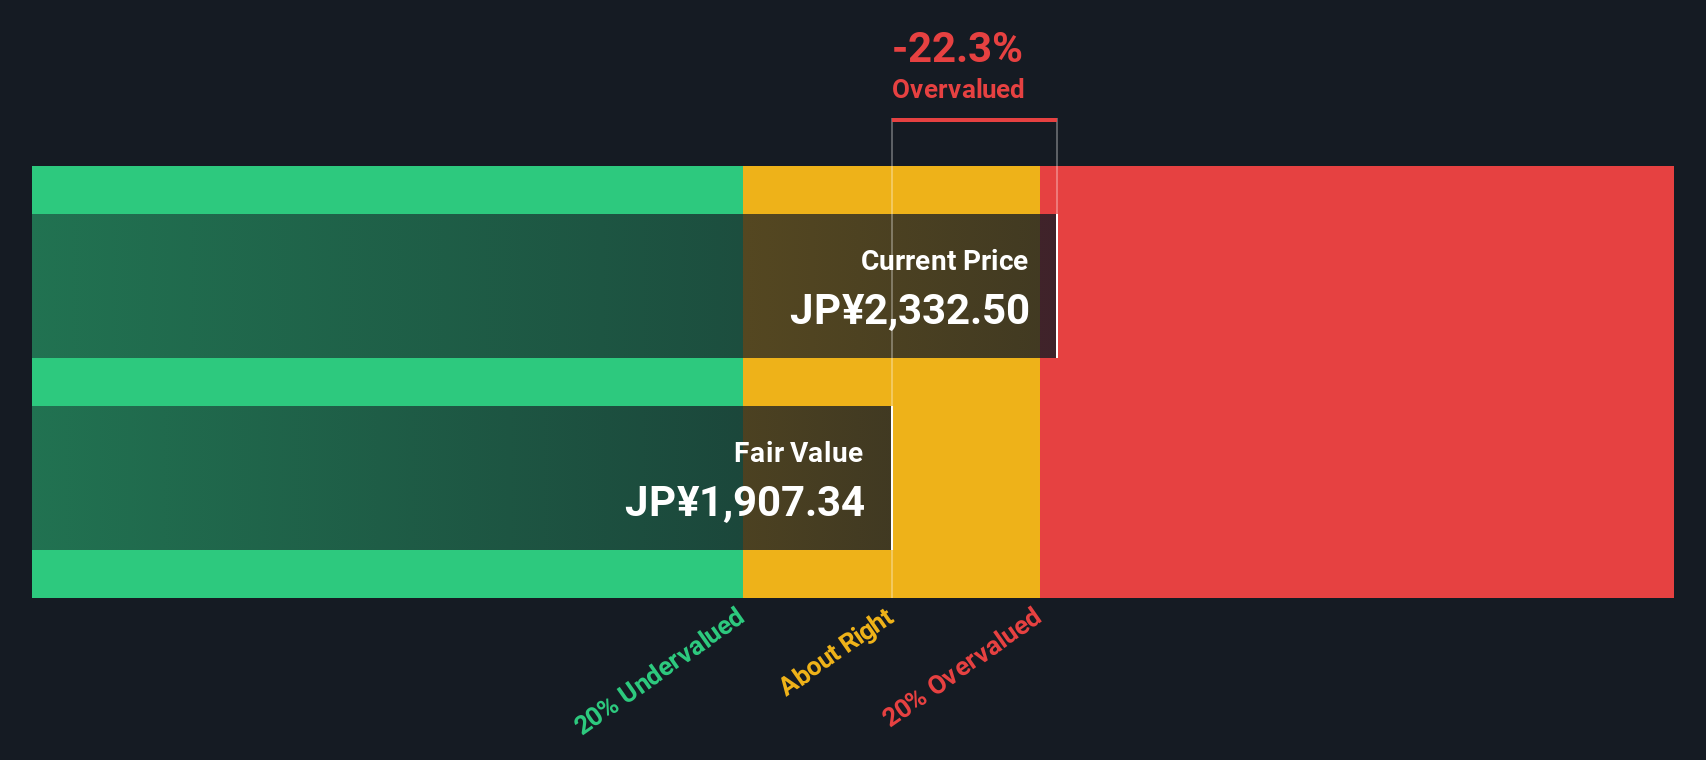
Taking a different approach, the SWS DCF model values M3 at ¥1,881 versus its current price of ¥2,302. This suggests the stock may be trading above its intrinsic value. This method focuses on future cash flows rather than earnings multiples and, by its measure, sees M3 as overvalued right now. Could the market be placing too much optimism on growth prospects?
Look into how the SWS DCF model arrives at its fair value.
Simply Wall St performs a discounted cash flow (DCF) on every stock in the world every day (check out M3 for example). We show the entire calculation in full. You can track the result in your watchlist or portfolio and be alerted when this changes, or use our stock screener to discover undervalued stocks based on their cash flows. If you save a screener we even alert you when new companies match - so you never miss a potential opportunity.
Build Your Own M3 Narrative
If you’d rather draw your own conclusions or question the above outlook, you can easily explore the numbers and shape your own view in just a few minutes. So why not Do it your way
A great starting point for your M3 research is our analysis highlighting 1 key reward and 1 important warning sign that could impact your investment decision.
Looking for more investment ideas?
Gain an edge in your portfolio by searching beyond the obvious. The next breakout winner could be where few are looking, so don’t let fresh opportunities pass you by.
- Tap into tomorrow’s tech leaders by spotting these 25 AI penny stocks primed to disrupt industries with artificial intelligence and next-generation automation.
- Power up your income strategy by finding these 18 dividend stocks with yields > 3% offering high yields and steady cash flow, which can be helpful for gaining stability in shifting markets.
- Unlock hidden potential by browsing these 3574 penny stocks with strong financials that combine solid financials with massive upside most investors overlook.
This article by Simply Wall St is general in nature. We provide commentary based on historical data and analyst forecasts only using an unbiased methodology and our articles are not intended to be financial advice. It does not constitute a recommendation to buy or sell any stock, and does not take account of your objectives, or your financial situation. We aim to bring you long-term focused analysis driven by fundamental data. Note that our analysis may not factor in the latest price-sensitive company announcements or qualitative material. Simply Wall St has no position in any stocks mentioned.
Mobile Infrastructure for Defense and Disaster
The next wave in robotics isn't humanoid. Its fully autonomous towers delivering 5G, ISR, and radar in under 30 minutes, anywhere.
Get the investor briefing before the next round of contracts
Sponsored On Behalf of CiTechNew: Manage All Your Stock Portfolios in One Place
We've created the ultimate portfolio companion for stock investors, and it's free.
• Connect an unlimited number of Portfolios and see your total in one currency
• Be alerted to new Warning Signs or Risks via email or mobile
• Track the Fair Value of your stocks
Have feedback on this article? Concerned about the content? Get in touch with us directly. Alternatively, email editorial-team@simplywallst.com
About TSE:2413
M3
Provides medical-related services to physicians and other healthcare professionals through the internet.
Excellent balance sheet with moderate growth potential.
Market Insights


Weekly Picks

Early mover in a fast growing industry. Likely to experience share price volatility as they scale


A case for CA$31.80 (undiluted), aka 8,616% upside from CA$0.37 (an 86 bagger!).


Moderation and Stabilisation: HOLD: Fair Price based on a 4-year Cycle is $12.08
Recently Updated Narratives

Airbnb Stock: Platform Growth in a World of Saturation and Scrutiny

Adobe Stock: AI-Fueled ARR Growth Pushes Guidance Higher, But Cost Pressures Loom

Thomson Reuters Stock: When Legal Intelligence Becomes Mission-Critical Infrastructure
Popular Narratives


Crazy Undervalued 42 Baggers Silver Play (Active & Running Mine)


NVDA: Expanding AI Demand Will Drive Major Data Center Investments Through 2026

The AI Infrastructure Giant Grows Into Its Valuation
Trending Discussion


