Advertisement
- Japan
- /
- Healthtech
- /
- TSE:2413
Assessing M3 Stock After Its 69% Rally and Positive Cash Flow Projections for 2025

Simply Wall St
Reviewed by Simply Wall St
If you are weighing your next move with M3 stock, you are definitely not alone. After all, few companies can headline with a year-to-date gain of 69.5% and a 62.0% rise over the last twelve months. These are not just impressive numbers on paper; they reflect a market waking up to something, even if the company’s longer-term record still shows steep declines of -41.0% over three years and -62.8% over five. In recent weeks, M3 has seen a minor dip of -1.9% over seven days but kept strong with a 3.3% gain over the last month, hinting at both volatility and potential in the short term.
Part of what is driving attention is a shifting sense of risk. While broad market optimism pushed many stocks higher this year, investors seem to be re-evaluating what M3’s growth prospects genuinely look like. Despite all this, the company’s current valuation score sits at 0 out of 6, meaning it is not classified as undervalued by any of the typical checks we run.
So what does this really mean for your investment decision? Over the next sections, we will break down the key valuation methods, and just as importantly, I will share an even more insightful way to approach M3’s valuation at the end of the article.
M3 scores just 0/6 on our valuation checks. See what other red flags we found in the full valuation breakdown.Approach 1: M3 Discounted Cash Flow (DCF) Analysis
The Discounted Cash Flow (DCF) model estimates a company’s intrinsic value by forecasting its future cash flows and discounting these amounts back to today’s value. Simply put, it helps investors gauge what M3 is worth based on expected cash that can be generated going forward.
As of the latest report, M3 generated Free Cash Flow (FCF) of ¥42.97 billion. According to analyst consensus and further projections, FCF is expected to rise steadily. Analysts estimate FCF will reach about ¥66.90 billion by March 2030, with projections from 2026 to 2030 showing continued growth. Notably, the first five years of forecasts are based on direct analyst inputs, while years beyond that are extrapolated by Simply Wall St to provide a longer-term view.
Using the 2 Stage Free Cash Flow to Equity model, the resulting intrinsic value for M3 is calculated at ¥1,907 per share. Comparing this to the current trading price, the intrinsic discount signals the stock is trading 22.0% above its fair value, meaning it is overvalued according to this approach.
Result: OVERVALUED
Head to the Valuation section of our Company Report for more details on how we arrive at this Fair Value for M3.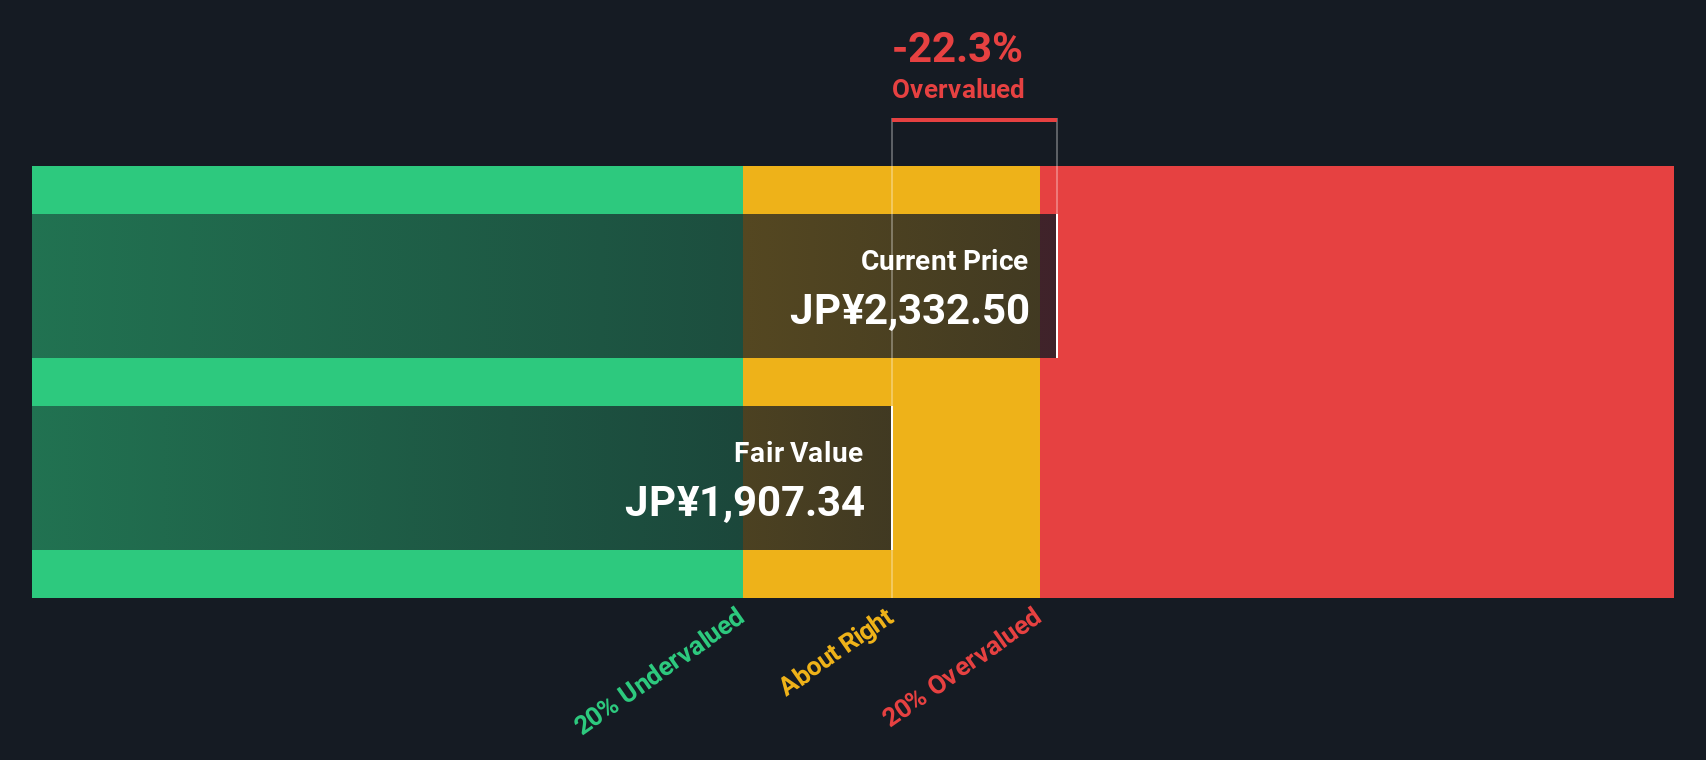
Approach 2: M3 Price vs Earnings (PE)
The Price-to-Earnings (PE) ratio is a widely used valuation metric for profitable companies like M3, as it directly relates the company’s stock price to its net earnings. For businesses with reliable profits, the PE ratio offers an intuitive snapshot of how much investors are willing to pay for each unit of earnings. This makes it especially effective for comparing mature, profitable firms within the same sector.
Determining what counts as a “normal” or “fair” PE ratio is not always straightforward. Expectations for growth and business risks play a big role in what the market is willing to pay. Companies with higher growth prospects typically warrant higher PE multiples, while elevated risk or low growth can drag them down.
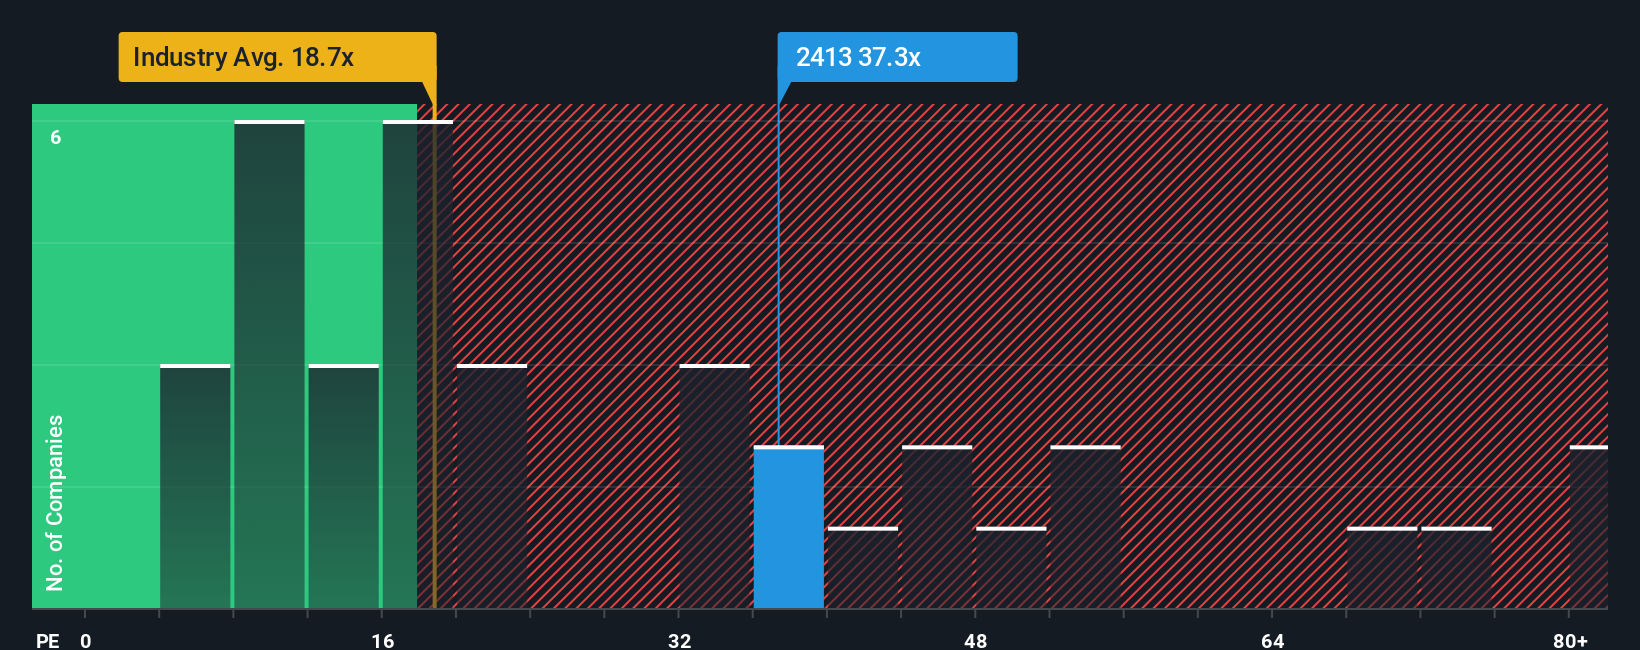
Right now, M3 trades at a PE ratio of 38.2x. That is slightly above both the industry average of 37.8x and its peer average of 37.9x. However, Simply Wall St’s proprietary Fair Ratio for M3, which is a more tailored benchmark that considers the company’s earnings growth, profit margins, risk, market cap, and position within the Healthcare Services industry, stands at 35.5x. Unlike a raw industry or peer comparison, this Fair Ratio adjusts for the unique factors driving M3’s value and yields a more precise perspective on whether the current multiple makes sense for the business.
Putting it all together, M3’s PE is just modestly above the Fair Ratio. The gap is not dramatic, suggesting that the stock is trading at about the right value relative to its earnings and prospects.
Result: ABOUT RIGHT
Upgrade Your Decision Making: Choose your M3 Narrative
Earlier we hinted at an even better way to understand valuation, so let’s introduce you to Narratives. A Narrative is your unique perspective and story behind a company like M3, connecting the numbers, such as your estimates for future revenue, earnings, and margins, to a financial forecast and ultimately a fair value. Narratives go beyond traditional analysis by letting you shape your own outlook, then directly see how your story stacks up against the current market price.
This innovative tool is available right on Simply Wall St’s Community page, where millions of investors share, compare, and refine their Narratives. Narratives are accessible and straightforward to use: you provide your assumptions, and as new news or earnings arrive, Narratives update dynamically to reflect the latest data.
By comparing your calculated Fair Value with the current share price, Narratives help you decide whether it is time to buy, sell, or hold. For example, one investor might project strong healthcare sector growth and a bright future for M3, resulting in a higher Fair Value, while another might focus on challenges in profitability and set a much lower value, showing how perspectives can vary widely.
Do you think there's more to the story for M3? Create your own Narrative to let the Community know!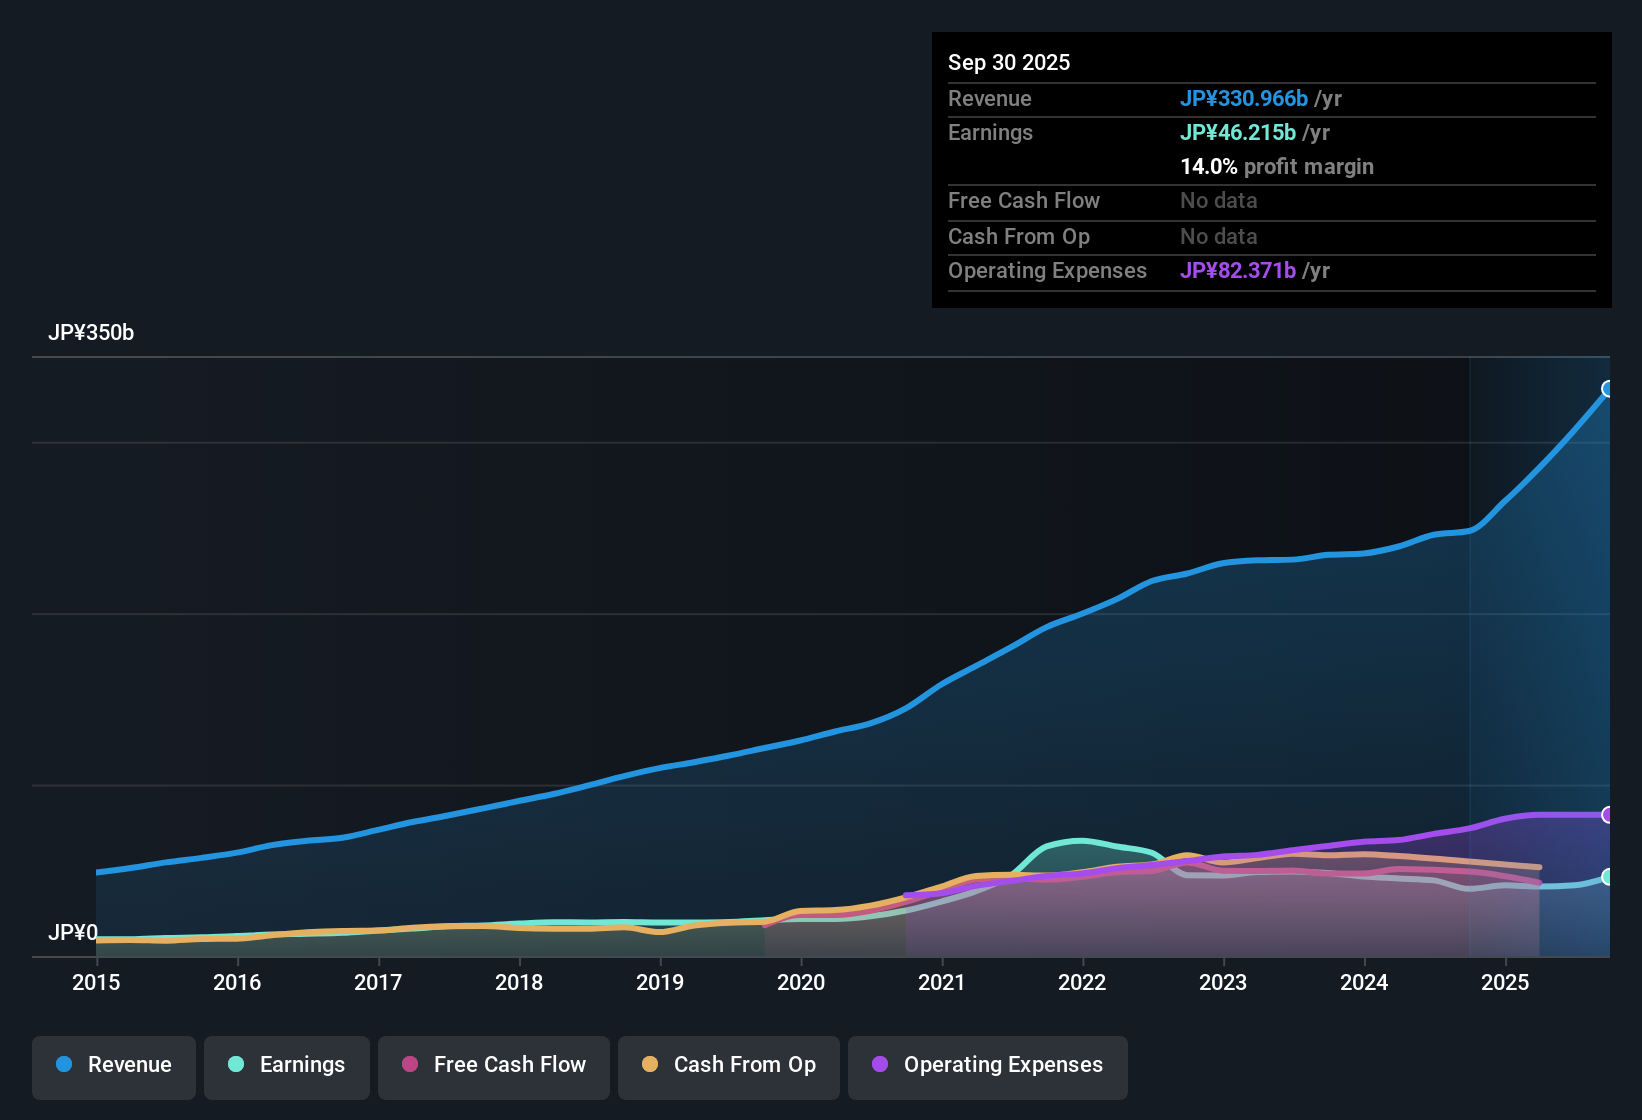
This article by Simply Wall St is general in nature. We provide commentary based on historical data and analyst forecasts only using an unbiased methodology and our articles are not intended to be financial advice. It does not constitute a recommendation to buy or sell any stock, and does not take account of your objectives, or your financial situation. We aim to bring you long-term focused analysis driven by fundamental data. Note that our analysis may not factor in the latest price-sensitive company announcements or qualitative material. Simply Wall St has no position in any stocks mentioned.
New: Manage All Your Stock Portfolios in One Place
We've created the ultimate portfolio companion for stock investors, and it's free.
• Connect an unlimited number of Portfolios and see your total in one currency
• Be alerted to new Warning Signs or Risks via email or mobile
• Track the Fair Value of your stocks
Have feedback on this article? Concerned about the content? Get in touch with us directly. Alternatively, email editorial-team@simplywallst.com
About TSE:2413
M3
Provides medical-related services to physicians and other healthcare professionals through the internet.
Excellent balance sheet with moderate growth potential.
Market Insights

Advertisement
Community Narratives
MINISO's fair value is projected at 26.69 with an anticipated PE ratio shift of 20x
Fair Value US$24.03|11.0% undervalued
BE
Community Contributor
Procter & Gamble: A Dividend Giant Facing Slowing Growth
Fair Value US$119.81|23.3% overvalued
AN
Community Contributor
Eli Lilly's Future Growth Driven by Tirzepatide and Favorable Market Conditions
Fair Value US$1.19k|13.8% undervalued
EA
Community Contributor