Advertisement
Sapporo Holdings (TSE:2501): Evaluating Valuation After Asahi Group’s Japan Production Halt Spurs Sector Interest

Simply Wall St
Reviewed by Kshitija Bhandaru
Following reports of a cyberattack at Asahi Group that halted production at most of its plants in Japan, Sapporo Holdings (TSE:2501) is drawing attention as investors consider how supply disruptions might shift demand in Japan’s beverage market.
See our latest analysis for Sapporo Holdings.
Sapporo Holdings’ recent share price performance has been relatively subdued, with the stock essentially flat over the past three months and the 1-year total shareholder return just shy of breaking even. Still, the Asahi production shutdown is putting a spotlight on possible opportunities for Sapporo, especially if market conditions tighten and consumer demand shifts. This is a dynamic some investors are already watching closely.
If sector shakeups like this have you looking for your next idea, it might be time to broaden your search and discover fast growing stocks with high insider ownership
With Sapporo’s muted returns despite industry upheaval, investors are left asking whether the stock is undervalued with overlooked upside or if the market is already factoring in any growth from recent events.
Price-to-Sales of 1.1x: Is it justified?
Sapporo Holdings is currently trading at a price-to-sales (P/S) ratio of 1.1x, which suggests the market is valuing each ¥1 in sales above its estimated fair value and almost exactly in line with peer valuations.
The price-to-sales ratio is a simple metric comparing a company's market capitalization to its annual revenue. For beverage companies, where profits may fluctuate with consumer trends or costs, P/S can offer a useful sense-check on how much investors are willing to pay for each unit of sales generated.
According to available data, Sapporo's P/S ratio of 1.1x is considered expensive relative to its estimated fair price-to-sales ratio of 0.9x. This suggests the current market price may be high versus what underlying revenues alone would justify, and the market is pricing in some expectations for either improved margins, growth, or other catalysts. In comparison to the Asian Beverage industry average of 2.2x, however, Sapporo appears to trade at a considerable discount, making it look comparatively cheap at a regional level.
Explore the SWS fair ratio for Sapporo Holdings
Result: Price-to-Sales of 1.1x (OVERVALUED)
However, risks remain, such as fading revenue momentum and an analyst price target below current levels. These factors could challenge the case for near-term upside.
Find out about the key risks to this Sapporo Holdings narrative.
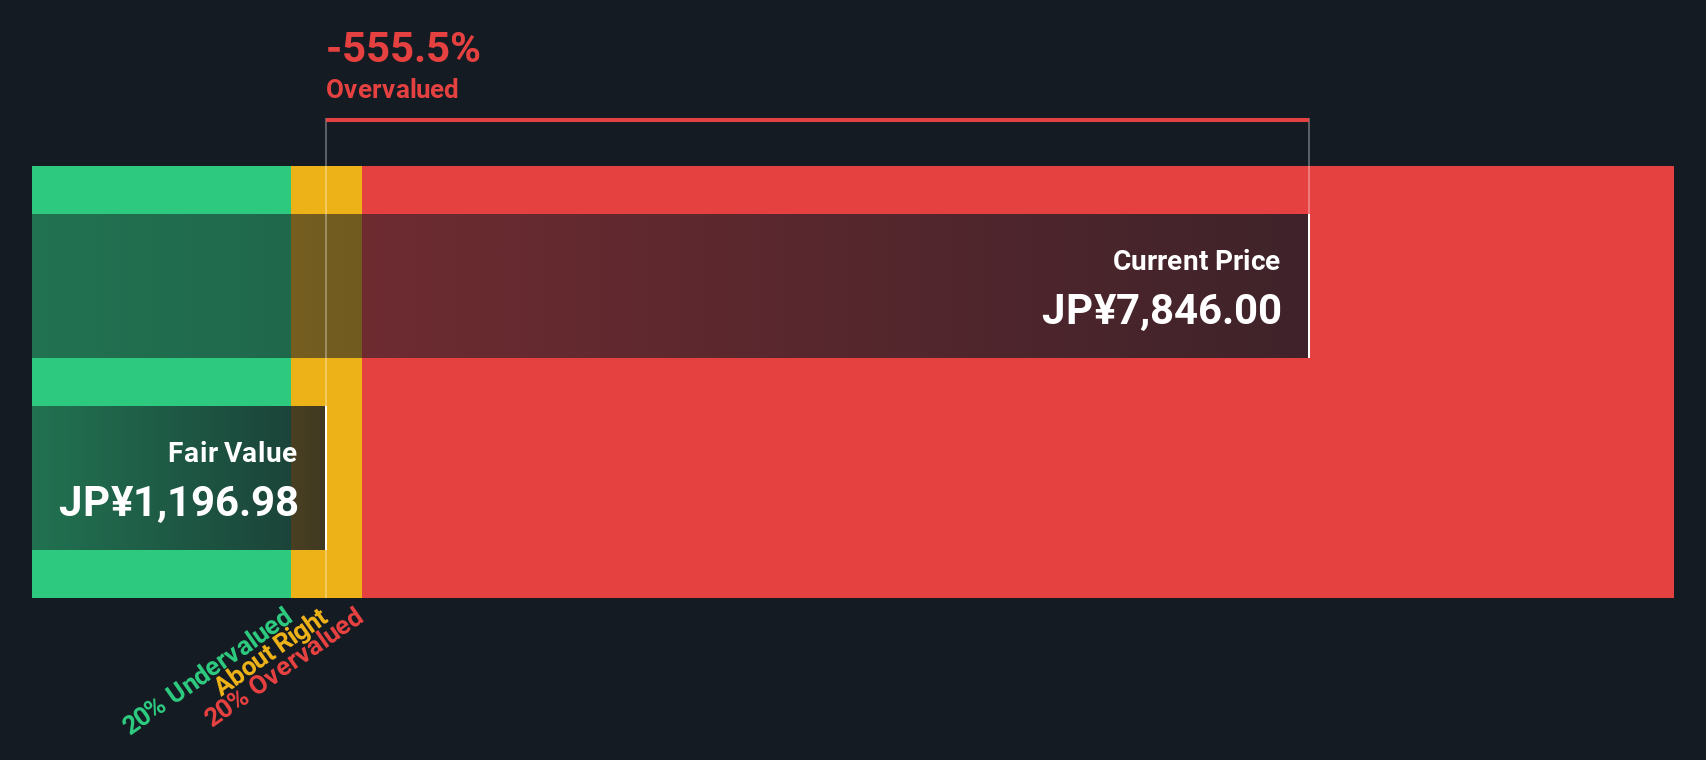
Another View: What Does the DCF Suggest?
While the current price-to-sales ratio paints Sapporo Holdings as potentially expensive, our DCF model arrives at a much lower estimate of fair value. This suggests the share price may be significantly overvalued on a cash flow basis. Does the market see something the DCF does not, or is it simply too optimistic?
Look into how the SWS DCF model arrives at its fair value.
Simply Wall St performs a discounted cash flow (DCF) on every stock in the world every day (check out Sapporo Holdings for example). We show the entire calculation in full. You can track the result in your watchlist or portfolio and be alerted when this changes, or use our stock screener to discover undervalued stocks based on their cash flows. If you save a screener we even alert you when new companies match - so you never miss a potential opportunity.
Build Your Own Sapporo Holdings Narrative
If you see the situation differently or want to dig into the numbers yourself, you can build a personalized view of Sapporo Holdings in just a few minutes, and Do it your way.
A great starting point for your Sapporo Holdings research is our analysis highlighting 1 key reward and 3 important warning signs that could impact your investment decision.
Looking for more investment ideas?
If you want results that stand out, don’t sit on the sidelines while others spot what’s next. Uncover tomorrow’s opportunities using our exclusive screeners below.
- Tap into emerging tech by browsing these 24 AI penny stocks that are harnessing artificial intelligence for bold new growth prospects.
- Amplify your search for passive income by zeroing in on these 19 dividend stocks with yields > 3% that offer reliable yields above 3%.
- Position yourself for upside potential with these 896 undervalued stocks based on cash flows trading well below their cash flow value right now.
This article by Simply Wall St is general in nature. We provide commentary based on historical data and analyst forecasts only using an unbiased methodology and our articles are not intended to be financial advice. It does not constitute a recommendation to buy or sell any stock, and does not take account of your objectives, or your financial situation. We aim to bring you long-term focused analysis driven by fundamental data. Note that our analysis may not factor in the latest price-sensitive company announcements or qualitative material. Simply Wall St has no position in any stocks mentioned.
New: Manage All Your Stock Portfolios in One Place
We've created the ultimate portfolio companion for stock investors, and it's free.
• Connect an unlimited number of Portfolios and see your total in one currency
• Be alerted to new Warning Signs or Risks via email or mobile
• Track the Fair Value of your stocks
Have feedback on this article? Concerned about the content? Get in touch with us directly. Alternatively, email editorial-team@simplywallst.com
About TSE:2501
Sapporo Holdings
Engages in alcoholic beverages, foods and soft drinks, restaurants, and real estate businesses in Japan and internationally.
Average dividend payer with moderate growth potential.
Similar Companies
Market Insights

Advertisement
Community Narratives
MINISO's fair value is projected at 26.69 with an anticipated PE ratio shift of 20x
Fair Value US$24.03|11.0% undervalued
BE
Community Contributor
Procter & Gamble: A Dividend Giant Facing Slowing Growth
Fair Value US$119.81|23.3% overvalued
AN
Community Contributor
Eli Lilly's Future Growth Driven by Tirzepatide and Favorable Market Conditions
Fair Value US$1.19k|13.8% undervalued
EA
Community Contributor