
Advertisement
If you are weighing your next move with Calbee shares, you are far from alone. Investors have watched the stock’s price zig-zag over recent months, and it is natural to wonder if opportunity or risk lies ahead. Over the last 30 days, Calbee climbed by 5.3%, reversing some of this year’s loss. Yet, it is still down 5.6% year to date and off 11.4% for the past 12 months. The slight drop in the past week, at -2.7%, hints at ongoing volatility as broader Japanese market sentiment reacts to shifting economic outlooks and consumer trends that influence companies like Calbee.
Notably, Calbee’s valuation score currently sits at 2 out of 6. This means the company only passes two major checks for being undervalued. This suggests that, at least through traditional valuation lenses, there might be room for further scrutiny. Movement in the share price could reflect investor debate about Calbee’s true worth, especially as market analysts reassess sector dynamics and snack food demand more broadly.
To figure out if Calbee stock truly deserves a spot in your portfolio, we will break down what these different valuation methods reveal. Before you make your final call, we will also explore a powerful perspective that goes beyond the usual numbers.
Calbee scores just 2/6 on our valuation checks. See what other red flags we found in the full valuation breakdown.Approach 1: Calbee Discounted Cash Flow (DCF) Analysis
The Discounted Cash Flow (DCF) model estimates a company's value by projecting its future cash flows and discounting them back to today's value. This method helps investors gauge whether a stock is trading above or below its underlying worth, based on anticipated financial performance.
For Calbee, the DCF approach relies on a "2 Stage Free Cash Flow to Equity" model. The company's current Free Cash Flow stands at approximately ¥13.8 billion. Analyst estimates and internal projections suggest steady growth, with Free Cash Flow expected to reach ¥20 billion by 2030. Over the next few years, annual forecasts suggest cash flows growing from ¥14.6 billion in 2026 up to ¥21.8 billion by 2029, with further extrapolated estimates beyond that period.
After discounting these projected figures to reflect their value in today's yen, the DCF model calculates Calbee's intrinsic fair value at ¥3,139 per share. With the current market price implying a discount of about 6.9%, the model suggests the stock is trading roughly in line with its underlying value, neither significantly undervalued nor overvalued at this time.
Result: ABOUT RIGHT
Head to the Valuation section of our Company Report for more details on how we arrive at this Fair Value for Calbee.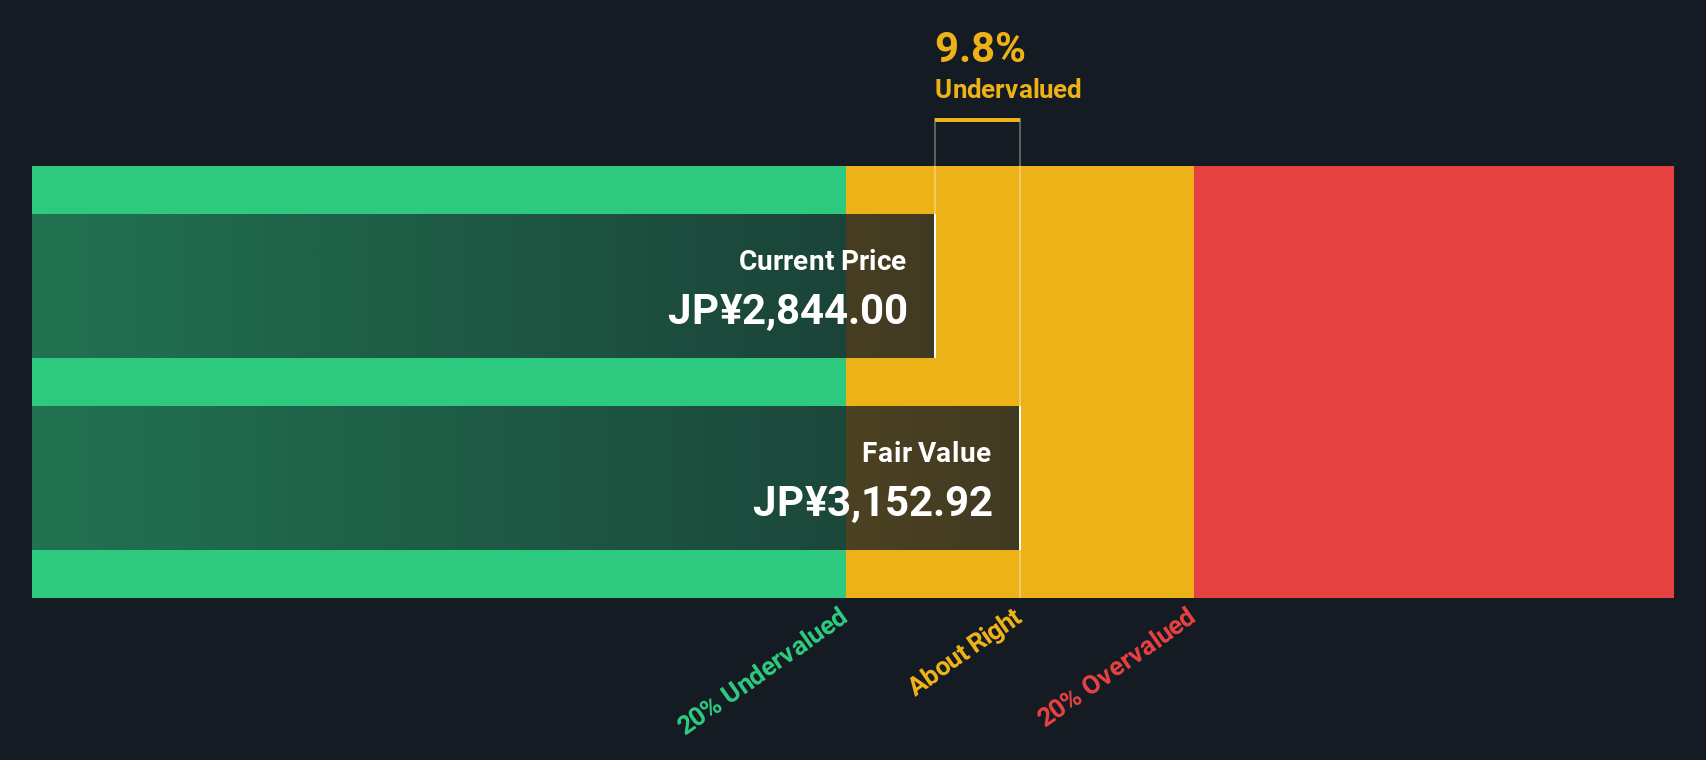
Approach 2: Calbee Price vs Earnings (PE Ratio)
The Price-to-Earnings (PE) ratio is a widely used valuation measure for profitable companies like Calbee, since it reflects how much investors are willing to pay for each yen of earnings. A company’s PE ratio helps investors weigh current price levels against future profit expectations. A higher ratio often indicates optimism about growth, while a lower one may signal greater risk or uncertainty.
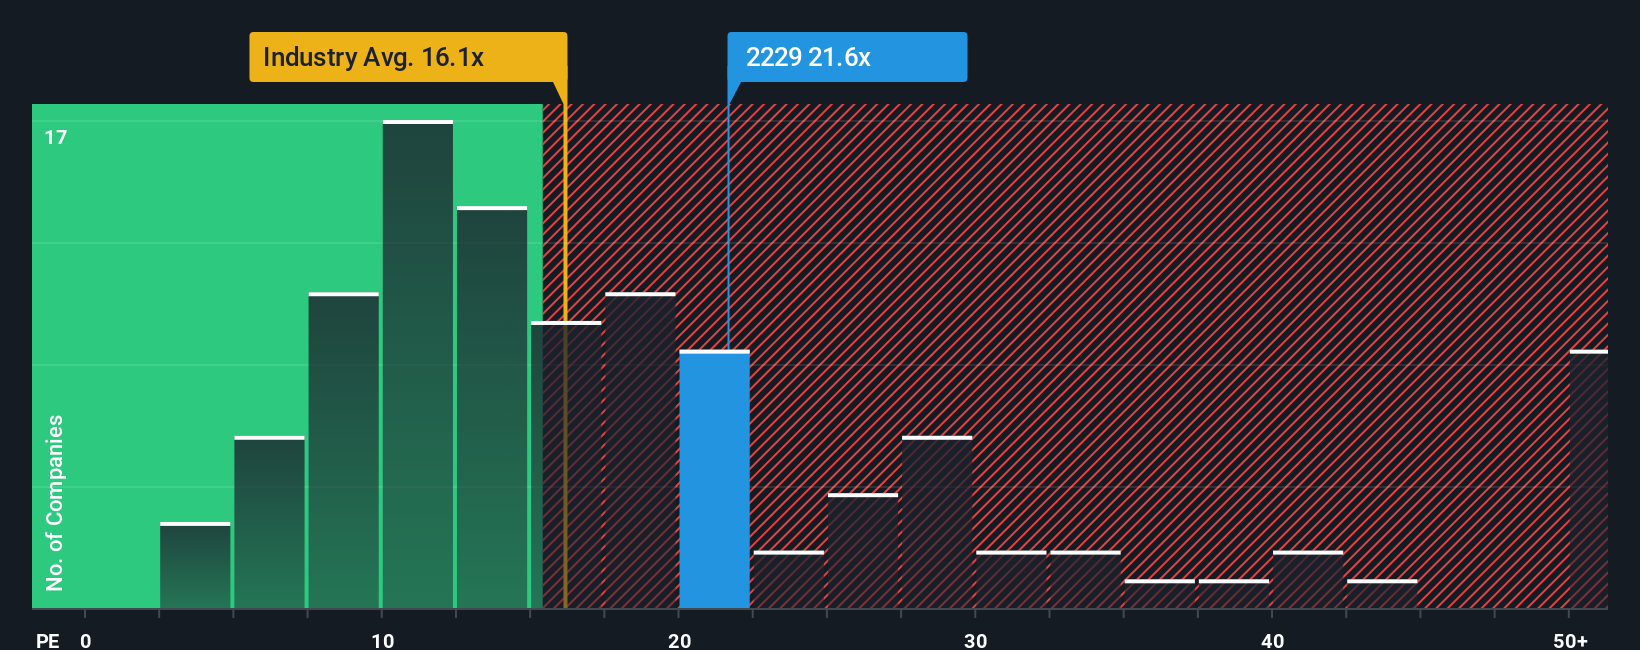
Calbee’s current PE ratio stands at 21.1x. Looking at benchmarks, this is a notch below the peer average of 22.9x but notably above the broader food industry average of 16.9x. This positioning suggests the market views Calbee more favorably than the typical company in its industry, but less so than its closest listed peers. These benchmark comparisons are useful, but do not account for all the specifics that can make a company’s “fair” valuation unique.
This is where Simply Wall St’s "Fair Ratio" comes into play. Unlike a simple industry or peer average, the Fair Ratio (19.0x for Calbee) blends in factors like earnings growth, profit margins, risk, and market capitalization. This creates a tailored benchmark for what a fair PE should be for Calbee specifically. Given that Calbee trades at 21.1x, very close to this Fair Ratio, the stock appears to be valued about where it should be based on its outlook and fundamentals.
Result: ABOUT RIGHT
Upgrade Your Decision Making: Choose your Calbee Narrative
Earlier we mentioned that there is an even better way to understand valuation, so let us introduce you to Narratives. A Narrative is your personal investment story, providing a clear, easy-to-use framework that helps you connect Calbee’s business outlook and market context directly to the numbers, such as fair value, revenue expectations, and profit margins.
With Narratives, you articulate your perspective on the company’s future, then map that story onto a financial forecast and see how it affects Calbee’s fair value. This approach is made simple on Simply Wall St’s Community page, where millions of investors build, share, and update their Narratives as new news or earnings come in. This keeps analysis current with the latest developments.
Narratives let you spot opportunities or risks at a glance by directly comparing Fair Value (from your Narrative or another user’s view) to the current market price, allowing you to assess when you might want to buy or sell. For instance, some investors believe Calbee’s fair value could be as high as ¥3,400 per share, while others see it closer to ¥2,800. This reflects a range of stories and expectations that adapt as new information emerges.
Do you think there's more to the story for Calbee? Create your own Narrative to let the Community know!
This article by Simply Wall St is general in nature. We provide commentary based on historical data and analyst forecasts only using an unbiased methodology and our articles are not intended to be financial advice. It does not constitute a recommendation to buy or sell any stock, and does not take account of your objectives, or your financial situation. We aim to bring you long-term focused analysis driven by fundamental data. Note that our analysis may not factor in the latest price-sensitive company announcements or qualitative material. Simply Wall St has no position in any stocks mentioned.
New: AI Stock Screener & Alerts
Our new AI Stock Screener scans the market every day to uncover opportunities.
• Dividend Powerhouses (3%+ Yield)
• Undervalued Small Caps with Insider Buying
• High growth Tech and AI Companies
Or build your own from over 50 metrics.
Have feedback on this article? Concerned about the content? Get in touch with us directly. Alternatively, email editorial-team@simplywallst.com
About TSE:2229
Calbee
Engages in the production and sale of snacks and other food products in Japan, North America, Greater China, Thailand, Singapore, Australia, rest of Asia, Hong Kong, the United Kingdom, Indonesia, and internationally.
Excellent balance sheet average dividend payer.
Similar Companies
Market Insights

Advertisement
Community Narratives
The company that turned a verb into a global necessity and basically runs the modern internet, digital ads, smartphones, maps, and AI.
Fair Value US$300.00|7.5% undervalued
OS
Community Contributor
Flowers Foods Pays A Fair Price For Health
Fair Value US$16.12|25.4% undervalued
NV
Community Contributor
TMX Group will thrive with 33.3% profit margin and enduring market moat
Fair Value CA$49.90|3.6% overvalued
LI
Community Contributor
The "Molecular Pencil": Why Beam's Technology is Built to Win
Fair Value US$65.01|65.0% undervalued
DA
Community Contributor