
Advertisement
Warren Buffett famously said, 'Volatility is far from synonymous with risk.' So it seems the smart money knows that debt - which is usually involved in bankruptcies - is a very important factor, when you assess how risky a company is. We note that Kanro Inc. (TSE:2216) does have debt on its balance sheet. But is this debt a concern to shareholders?
When Is Debt A Problem?
Debt and other liabilities become risky for a business when it cannot easily fulfill those obligations, either with free cash flow or by raising capital at an attractive price. Ultimately, if the company can't fulfill its legal obligations to repay debt, shareholders could walk away with nothing. However, a more common (but still painful) scenario is that it has to raise new equity capital at a low price, thus permanently diluting shareholders. By replacing dilution, though, debt can be an extremely good tool for businesses that need capital to invest in growth at high rates of return. The first step when considering a company's debt levels is to consider its cash and debt together.
What Is Kanro's Net Debt?
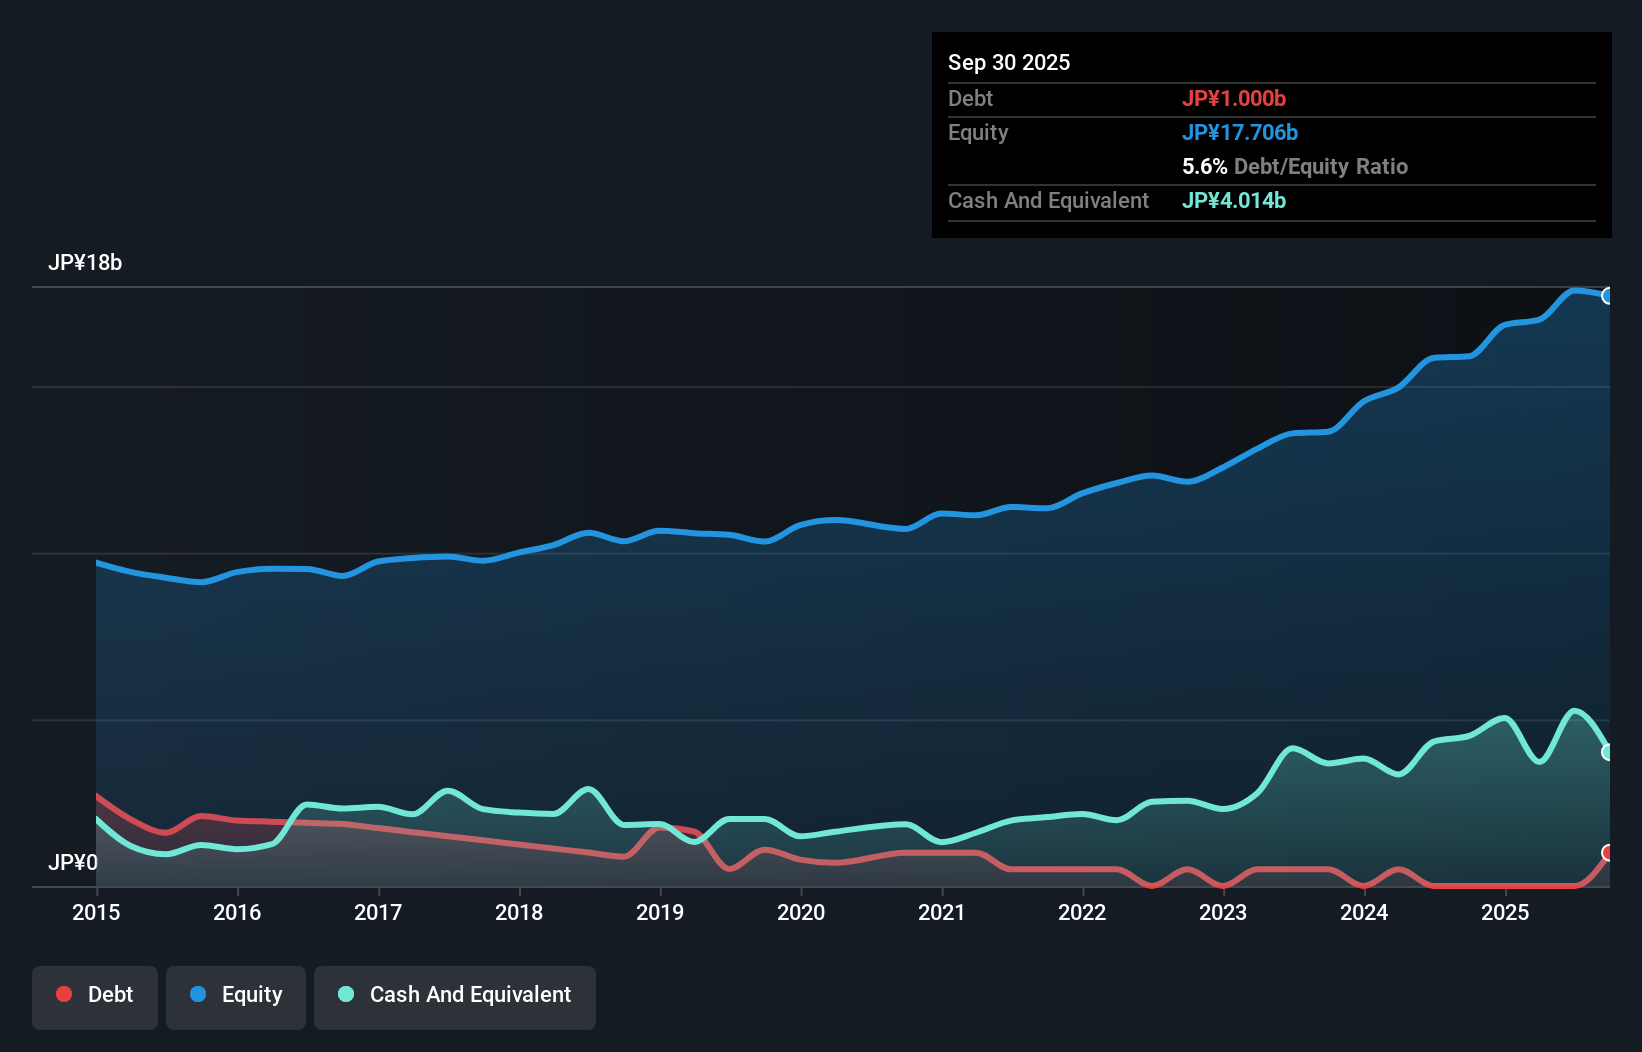
The image below, which you can click on for greater detail, shows that at September 2025 Kanro had debt of JP¥1.00b, up from none in one year. But it also has JP¥4.01b in cash to offset that, meaning it has JP¥3.01b net cash.
A Look At Kanro's Liabilities
The latest balance sheet data shows that Kanro had liabilities of JP¥8.74b due within a year, and liabilities of JP¥2.70b falling due after that. On the other hand, it had cash of JP¥4.01b and JP¥6.84b worth of receivables due within a year. So its liabilities total JP¥587.1m more than the combination of its cash and short-term receivables.
Having regard to Kanro's size, it seems that its liquid assets are well balanced with its total liabilities. So while it's hard to imagine that the JP¥68.8b company is struggling for cash, we still think it's worth monitoring its balance sheet. While it does have liabilities worth noting, Kanro also has more cash than debt, so we're pretty confident it can manage its debt safely.
Check out our latest analysis for Kanro
Fortunately, Kanro grew its EBIT by 4.1% in the last year, making that debt load look even more manageable. The balance sheet is clearly the area to focus on when you are analysing debt. But you can't view debt in total isolation; since Kanro will need earnings to service that debt. So if you're keen to discover more about its earnings, it might be worth checking out this graph of its long term earnings trend.
But our final consideration is also important, because a company cannot pay debt with paper profits; it needs cold hard cash. While Kanro has net cash on its balance sheet, it's still worth taking a look at its ability to convert earnings before interest and tax (EBIT) to free cash flow, to help us understand how quickly it is building (or eroding) that cash balance. In the last three years, Kanro's free cash flow amounted to 49% of its EBIT, less than we'd expect. That weak cash conversion makes it more difficult to handle indebtedness.
Summing Up
We could understand if investors are concerned about Kanro's liabilities, but we can be reassured by the fact it has has net cash of JP¥3.01b. On top of that, it increased its EBIT by 4.1% in the last twelve months. So we are not troubled with Kanro's debt use. When analysing debt levels, the balance sheet is the obvious place to start. But ultimately, every company can contain risks that exist outside of the balance sheet. Be aware that Kanro is showing 1 warning sign in our investment analysis , you should know about...
At the end of the day, it's often better to focus on companies that are free from net debt. You can access our special list of such companies (all with a track record of profit growth). It's free.
Valuation is complex, but we're here to simplify it.
Discover if Kanro might be undervalued or overvalued with our detailed analysis, featuring fair value estimates, potential risks, dividends, insider trades, and its financial condition.
Access Free AnalysisHave feedback on this article? Concerned about the content? Get in touch with us directly. Alternatively, email editorial-team (at) simplywallst.com.
This article by Simply Wall St is general in nature. We provide commentary based on historical data and analyst forecasts only using an unbiased methodology and our articles are not intended to be financial advice. It does not constitute a recommendation to buy or sell any stock, and does not take account of your objectives, or your financial situation. We aim to bring you long-term focused analysis driven by fundamental data. Note that our analysis may not factor in the latest price-sensitive company announcements or qualitative material. Simply Wall St has no position in any stocks mentioned.
About TSE:2216
Flawless balance sheet established dividend payer.
Market Insights

Advertisement
Community Narratives
MINISO's fair value is projected at 26.69 with an anticipated PE ratio shift of 20x
Fair Value US$24.03|11.0% undervalued
BE
Community Contributor
Procter & Gamble: A Dividend Giant Facing Slowing Growth
Fair Value US$119.81|23.3% overvalued
AN
Community Contributor
Eli Lilly's Future Growth Driven by Tirzepatide and Favorable Market Conditions
Fair Value US$1.19k|13.8% undervalued
EA
Community Contributor