
Advertisement
Key Insights
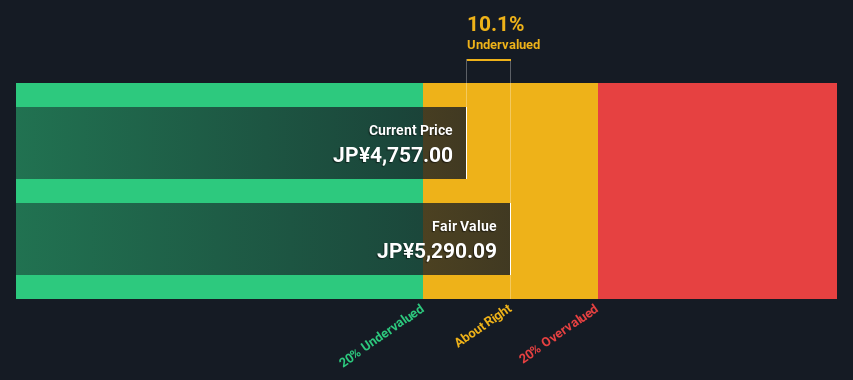
- Using the 2 Stage Free Cash Flow to Equity, Ezaki Glico fair value estimate is JP¥5,290
- Ezaki Glico's JP¥4,757 share price indicates it is trading at similar levels as its fair value estimate
- Analyst price target for 2206 is JP¥3,733 which is 29% below our fair value estimate
In this article we are going to estimate the intrinsic value of Ezaki Glico Co., Ltd. (TSE:2206) by taking the forecast future cash flows of the company and discounting them back to today's value. This will be done using the Discounted Cash Flow (DCF) model. There's really not all that much to it, even though it might appear quite complex.
Remember though, that there are many ways to estimate a company's value, and a DCF is just one method. If you want to learn more about discounted cash flow, the rationale behind this calculation can be read in detail in the Simply Wall St analysis model.
View our latest analysis for Ezaki Glico
Crunching The Numbers
We use what is known as a 2-stage model, which simply means we have two different periods of growth rates for the company's cash flows. Generally the first stage is higher growth, and the second stage is a lower growth phase. To begin with, we have to get estimates of the next ten years of cash flows. Where possible we use analyst estimates, but when these aren't available we extrapolate the previous free cash flow (FCF) from the last estimate or reported value. We assume companies with shrinking free cash flow will slow their rate of shrinkage, and that companies with growing free cash flow will see their growth rate slow, over this period. We do this to reflect that growth tends to slow more in the early years than it does in later years.
Generally we assume that a dollar today is more valuable than a dollar in the future, so we need to discount the sum of these future cash flows to arrive at a present value estimate:
10-year free cash flow (FCF) estimate
| 2025 | 2026 | 2027 | 2028 | 2029 | 2030 | 2031 | 2032 | 2033 | 2034 | |
| Levered FCF (¥, Millions) | JP¥13.4b | JP¥12.3b | JP¥14.0b | JP¥14.2b | JP¥14.3b | JP¥14.5b | JP¥14.6b | JP¥14.7b | JP¥14.8b | JP¥14.9b |
| Growth Rate Estimate Source | Analyst x1 | Analyst x2 | Analyst x1 | Est @ 1.54% | Est @ 1.19% | Est @ 0.94% | Est @ 0.77% | Est @ 0.65% | Est @ 0.57% | Est @ 0.51% |
| Present Value (¥, Millions) Discounted @ 4.6% | JP¥12.8k | JP¥11.3k | JP¥12.2k | JP¥11.9k | JP¥11.5k | JP¥11.1k | JP¥10.7k | JP¥10.3k | JP¥9.9k | JP¥9.5k |
("Est" = FCF growth rate estimated by Simply Wall St)
Present Value of 10-year Cash Flow (PVCF) = JP¥111b
We now need to calculate the Terminal Value, which accounts for all the future cash flows after this ten year period. The Gordon Growth formula is used to calculate Terminal Value at a future annual growth rate equal to the 5-year average of the 10-year government bond yield of 0.4%. We discount the terminal cash flows to today's value at a cost of equity of 4.6%.
Terminal Value (TV)= FCF2034 × (1 + g) ÷ (r – g) = JP¥15b× (1 + 0.4%) ÷ (4.6%– 0.4%) = JP¥354b
Present Value of Terminal Value (PVTV)= TV / (1 + r)10= JP¥354b÷ ( 1 + 4.6%)10= JP¥226b
The total value is the sum of cash flows for the next ten years plus the discounted terminal value, which results in the Total Equity Value, which in this case is JP¥337b. In the final step we divide the equity value by the number of shares outstanding. Relative to the current share price of JP¥4.8k, the company appears about fair value at a 10% discount to where the stock price trades currently. The assumptions in any calculation have a big impact on the valuation, so it is better to view this as a rough estimate, not precise down to the last cent.
Important Assumptions
Now the most important inputs to a discounted cash flow are the discount rate, and of course, the actual cash flows. You don't have to agree with these inputs, I recommend redoing the calculations yourself and playing with them. The DCF also does not consider the possible cyclicality of an industry, or a company's future capital requirements, so it does not give a full picture of a company's potential performance. Given that we are looking at Ezaki Glico as potential shareholders, the cost of equity is used as the discount rate, rather than the cost of capital (or weighted average cost of capital, WACC) which accounts for debt. In this calculation we've used 4.6%, which is based on a levered beta of 0.800. Beta is a measure of a stock's volatility, compared to the market as a whole. We get our beta from the industry average beta of globally comparable companies, with an imposed limit between 0.8 and 2.0, which is a reasonable range for a stable business.
SWOT Analysis for Ezaki Glico
Strength
- Debt is not viewed as a risk.
- Dividends are covered by earnings and cash flows.
Weakness
- Earnings declined over the past year.
- Dividend is low compared to the top 25% of dividend payers in the Food market.
Opportunity
- Annual earnings are forecast to grow faster than the Japanese market.
- Current share price is below our estimate of fair value.
Threat
- Annual revenue is forecast to grow slower than the Japanese market.
Looking Ahead:
Although the valuation of a company is important, it is only one of many factors that you need to assess for a company. DCF models are not the be-all and end-all of investment valuation. Preferably you'd apply different cases and assumptions and see how they would impact the company's valuation. If a company grows at a different rate, or if its cost of equity or risk free rate changes sharply, the output can look very different. For Ezaki Glico, there are three relevant items you should assess:
- Risks: As an example, we've found 2 warning signs for Ezaki Glico that you need to consider before investing here.
- Future Earnings: How does 2206's growth rate compare to its peers and the wider market? Dig deeper into the analyst consensus number for the upcoming years by interacting with our free analyst growth expectation chart.
- Other Solid Businesses: Low debt, high returns on equity and good past performance are fundamental to a strong business. Why not explore our interactive list of stocks with solid business fundamentals to see if there are other companies you may not have considered!
PS. Simply Wall St updates its DCF calculation for every Japanese stock every day, so if you want to find the intrinsic value of any other stock just search here.
Valuation is complex, but we're here to simplify it.
Discover if Ezaki Glico might be undervalued or overvalued with our detailed analysis, featuring fair value estimates, potential risks, dividends, insider trades, and its financial condition.
Access Free AnalysisHave feedback on this article? Concerned about the content? Get in touch with us directly. Alternatively, email editorial-team (at) simplywallst.com.
This article by Simply Wall St is general in nature. We provide commentary based on historical data and analyst forecasts only using an unbiased methodology and our articles are not intended to be financial advice. It does not constitute a recommendation to buy or sell any stock, and does not take account of your objectives, or your financial situation. We aim to bring you long-term focused analysis driven by fundamental data. Note that our analysis may not factor in the latest price-sensitive company announcements or qualitative material. Simply Wall St has no position in any stocks mentioned.
About TSE:2206
Ezaki Glico
Produces and sells confectionery, food, dairy products, and food ingredients in Japan, China, Southeast Asia, the United States, and internationally.
Excellent balance sheet second-rate dividend payer.
Similar Companies
Market Insights


Advertisement
Community Narratives
The Next Phase of Energy Storage: How NeoVolta Is Tackling America’s Power Crunch
Fair Value US$7.50|39.3% undervalued
MA
Community Contributor
Why EnSilica is Worth Possibly 13x its Current Price
Fair Value UK£5.00|91.8% undervalued
DO
Community Contributor
A case for Cassiar Gold Corp (TSXV: GLDC) to reach CAD$8-10 before 2030 (X30-37)
Fair Value CA$10.00|97.4% undervalued
AG
Community Contributor
M&A Activity, Industry Diversification & A Defense Contract Monopoly Will Push BWXT For Healthy Long-Term Growth
Fair Value US$220.00|17.3% undervalued
CL
Community Contributor