Advertisement
Maruha Nichiro (TSE:1333): Assessing Valuation After Stock Split, Dividend Changes and Profit Outlook Update

Simply Wall St
Reviewed by Simply Wall St
Maruha Nichiro (TSE:1333) just announced a 3-for-1 stock split, a revised dividend policy, and flagged a likely drop in full-year profit. This follows modest growth in sales and operating income but a nearly 10% profit decline.
See our latest analysis for Maruha Nichiro.
Maruha Nichiro’s latest moves come on the back of strong positive momentum. The stock notched a 20.4% year-to-date share price return, outpacing many peers, and its 23.8% one-year total shareholder return highlights management’s efforts despite near-term profit headwinds.
If these recent shifts have you looking for your next pick, now’s an opportune moment to broaden your investing radar and discover fast growing stocks with high insider ownership
With shares rallying over the past year but earnings guidance pointing lower, the question is whether Maruha Nichiro offers a rare value entry or if the market has already adjusted for future growth prospects.
Price-to-Earnings of 8.4x: Is it justified?
Maruha Nichiro currently trades at a price-to-earnings (P/E) ratio of 8.4x, which places it well below both peer and industry averages. At the last close of ¥3,657, the market seems to be pricing in limited earnings growth or heightened risk, even as the company shows recent operational momentum.
The price-to-earnings multiple represents how much investors are willing to pay for each yen of the company’s earnings. For diversified food producers such as Maruha Nichiro, the P/E ratio often reflects expectations around stable and mature growth with moderate margins. It can also signal caution if earnings are volatile.
Compared to its peer average of 10.8x and the wider Japanese food industry average of 16.4x, Maruha Nichiro’s P/E ratio is notably low. This suggests the market is discounting its future prospects relative to competitors. If the company achieves renewed earnings growth or margin improvements, there may be room for the multiple to move closer to sector levels over time.
See what the numbers say about this price — find out in our valuation breakdown.
Result: Price-to-Earnings of 8.4x (UNDERVALUED)
However, weaker net income growth and uncertainty in overall industry conditions may make it difficult for Maruha Nichiro to sustain recent share price momentum.
Find out about the key risks to this Maruha Nichiro narrative.
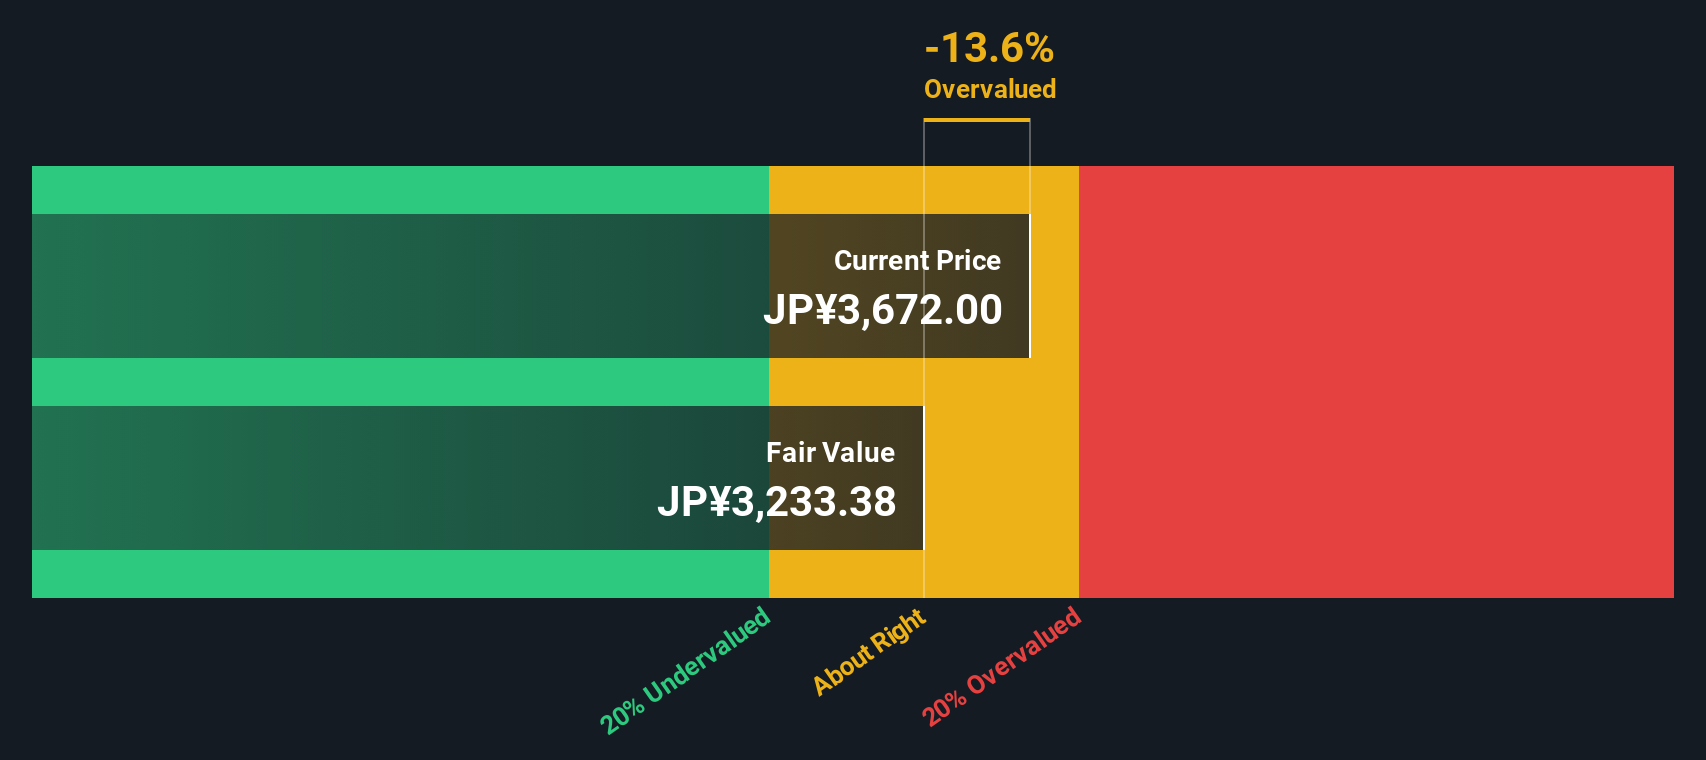
Another View: Our DCF Model Puts Maruha Nichiro Deeply Undervalued
While the P/E ratio shows Maruha Nichiro discounted against peers, our SWS DCF model takes a different approach. It estimates the fair value at ¥7,089.4 per share, which is about 48% above today’s price. Does this signal a potential bargain or simply reflect different assumptions about the future?
Look into how the SWS DCF model arrives at its fair value.
Simply Wall St performs a discounted cash flow (DCF) on every stock in the world every day (check out Maruha Nichiro for example). We show the entire calculation in full. You can track the result in your watchlist or portfolio and be alerted when this changes, or use our stock screener to discover 885 undervalued stocks based on their cash flows. If you save a screener we even alert you when new companies match - so you never miss a potential opportunity.
Build Your Own Maruha Nichiro Narrative
If you think there’s another angle or want to dig deeper, you can easily build your own perspective using our tools in just a few minutes. Do it your way
A great starting point for your Maruha Nichiro research is our analysis highlighting 2 key rewards and 1 important warning sign that could impact your investment decision.
Looking for more investment ideas?
Limit yourself to one stock and you could miss game-changing gains. Supercharge your investing strategy by checking out these standout opportunities handpicked for savvy investors:
- Capitalize on untapped value by reviewing these 885 undervalued stocks based on cash flows that financial models highlight as trading well below their fair value.
- Unlock new income streams by scanning these 14 dividend stocks with yields > 3% featuring stocks with reliable yields above 3%.
- Stay ahead of the curve by sizing up these 27 AI penny stocks with potential to transform industries through advances in artificial intelligence.
This article by Simply Wall St is general in nature. We provide commentary based on historical data and analyst forecasts only using an unbiased methodology and our articles are not intended to be financial advice. It does not constitute a recommendation to buy or sell any stock, and does not take account of your objectives, or your financial situation. We aim to bring you long-term focused analysis driven by fundamental data. Note that our analysis may not factor in the latest price-sensitive company announcements or qualitative material. Simply Wall St has no position in any stocks mentioned.
New: Manage All Your Stock Portfolios in One Place
We've created the ultimate portfolio companion for stock investors, and it's free.
• Connect an unlimited number of Portfolios and see your total in one currency
• Be alerted to new Warning Signs or Risks via email or mobile
• Track the Fair Value of your stocks
Have feedback on this article? Concerned about the content? Get in touch with us directly. Alternatively, email editorial-team@simplywallst.com
About TSE:1333
Maruha Nichiro
Engages in the fishing, fish farming, food processing, trading, meat products, and distribution businesses in Japan and internationally.
Established dividend payer and good value.
Similar Companies
Market Insights

Advertisement
Community Narratives
MINISO's fair value is projected at 26.69 with an anticipated PE ratio shift of 20x
Fair Value US$24.03|9.0% undervalued
BE
Community Contributor
Procter & Gamble: A Dividend Giant Facing Slowing Growth
Fair Value US$119.81|23.5% overvalued
AN
Community Contributor
Eli Lilly's Future Growth Driven by Tirzepatide and Favorable Market Conditions
Fair Value US$1.19k|14.4% undervalued
EA
Community Contributor