- Japan
- /
- Oil and Gas
- /
- TSE:8132
Sinanen Holdings (TSE:8132) delivers shareholders stellar 28% CAGR over 5 years, surging 12% in the last week alone

When you buy a stock there is always a possibility that it could drop 100%. But on the bright side, if you buy shares in a high quality company at the right price, you can gain well over 100%. For example, the Sinanen Holdings Co., Ltd. (TSE:8132) share price has soared 210% in the last half decade. Most would be very happy with that. Better yet, the share price has risen 12% in the last week.
Since the stock has added JP¥6.4b to its market cap in the past week alone, let's see if underlying performance has been driving long-term returns.
See our latest analysis for Sinanen Holdings
To paraphrase Benjamin Graham: Over the short term the market is a voting machine, but over the long term it's a weighing machine. One imperfect but simple way to consider how the market perception of a company has shifted is to compare the change in the earnings per share (EPS) with the share price movement.
During five years of share price growth, Sinanen Holdings actually saw its EPS drop 30% per year.
Essentially, it doesn't seem likely that investors are focused on EPS. Because earnings per share don't seem to match up with the share price, we'll take a look at other metrics instead.
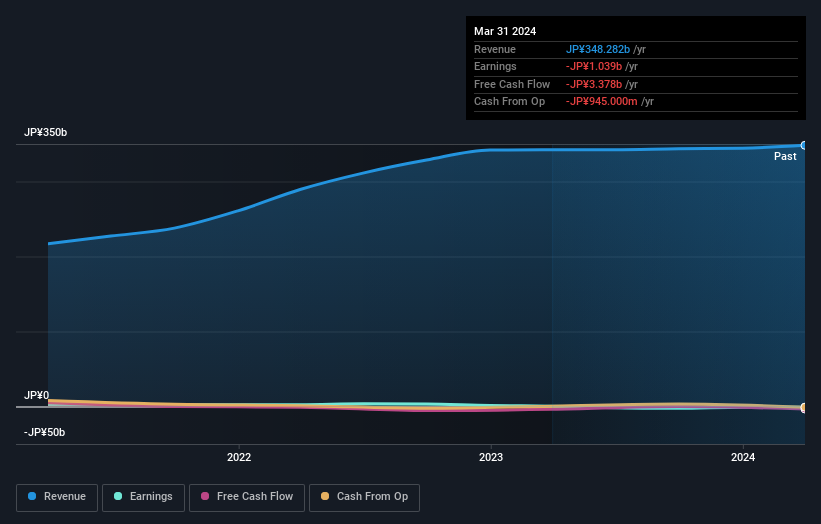
The modest 1.4% dividend yield is unlikely to be propping up the share price. In contrast revenue growth of 11% per year is probably viewed as evidence that Sinanen Holdings is growing, a real positive. In that case, the company may be sacrificing current earnings per share to drive growth.
The graphic below depicts how earnings and revenue have changed over time (unveil the exact values by clicking on the image).
Take a more thorough look at Sinanen Holdings' financial health with this free report on its balance sheet.
What About Dividends?
When looking at investment returns, it is important to consider the difference between total shareholder return (TSR) and share price return. The TSR incorporates the value of any spin-offs or discounted capital raisings, along with any dividends, based on the assumption that the dividends are reinvested. Arguably, the TSR gives a more comprehensive picture of the return generated by a stock. As it happens, Sinanen Holdings' TSR for the last 5 years was 246%, which exceeds the share price return mentioned earlier. And there's no prize for guessing that the dividend payments largely explain the divergence!
A Different Perspective
We're pleased to report that Sinanen Holdings shareholders have received a total shareholder return of 38% over one year. And that does include the dividend. Since the one-year TSR is better than the five-year TSR (the latter coming in at 28% per year), it would seem that the stock's performance has improved in recent times. Someone with an optimistic perspective could view the recent improvement in TSR as indicating that the business itself is getting better with time. It's always interesting to track share price performance over the longer term. But to understand Sinanen Holdings better, we need to consider many other factors. Take risks, for example - Sinanen Holdings has 1 warning sign we think you should be aware of.
We will like Sinanen Holdings better if we see some big insider buys. While we wait, check out this free list of undervalued stocks (mostly small caps) with considerable, recent, insider buying.
Please note, the market returns quoted in this article reflect the market weighted average returns of stocks that currently trade on Japanese exchanges.
New: Manage All Your Stock Portfolios in One Place
We've created the ultimate portfolio companion for stock investors, and it's free.
• Connect an unlimited number of Portfolios and see your total in one currency
• Be alerted to new Warning Signs or Risks via email or mobile
• Track the Fair Value of your stocks
Have feedback on this article? Concerned about the content? Get in touch with us directly. Alternatively, email editorial-team (at) simplywallst.com.
This article by Simply Wall St is general in nature. We provide commentary based on historical data and analyst forecasts only using an unbiased methodology and our articles are not intended to be financial advice. It does not constitute a recommendation to buy or sell any stock, and does not take account of your objectives, or your financial situation. We aim to bring you long-term focused analysis driven by fundamental data. Note that our analysis may not factor in the latest price-sensitive company announcements or qualitative material. Simply Wall St has no position in any stocks mentioned.
Have feedback on this article? Concerned about the content? Get in touch with us directly. Alternatively, email editorial-team@simplywallst.com
About TSE:8132
Sinanen Holdings
Engages in the energy and non-energy related businesses in Japan and internationally.
Mediocre balance sheet and slightly overvalued.
