Advertisement
- Japan
- /
- Diversified Financial
- /
- TSE:7148
A Look at Financial Partners Group Ltd’s (TSE:7148) Valuation After Securing a Major Debt Financing Deal

Simply Wall St
Reviewed by Simply Wall St
Financial Partners GroupLtd (TSE:7148) just finalized a significant loan agreement with a financial institution. The agreement totals JPY 13.5 billion and includes specific financial covenants that will shape its capital commitments through October 2026.
See our latest analysis for Financial Partners GroupLtd.
It has certainly been a year of mixed signals for Financial Partners GroupLtd. The latest loan agreement comes after a challenging stretch, as the share price is still down nearly 20% year-to-date and the 1-year total shareholder return sits at -18.3%. However, those looking farther back will notice the company remains a long-term success story, with a total shareholder return of 147.9% over three years and a remarkable 467.2% over five years, even as near-term momentum has faded for now.
If big capital moves like this have you wondering what other opportunities might be out there, it could be the perfect moment to discover fast growing stocks with high insider ownership
With shares now trading at a sizable discount to analyst targets and robust growth figures in recent years, the key question is whether Financial Partners GroupLtd offers hidden value at today’s price or if the market already expects more good news ahead.
Price-to-Earnings of 10.6x: Is it justified?
Financial Partners GroupLtd is trading at a price-to-earnings (P/E) ratio of 10.6x, which stands out against industry and peer benchmarks. With the company's last close at ¥2,301, this figure hints at a potential discount in its valuation based on current earnings.
The price-to-earnings ratio measures how much investors are willing to pay for each yen of earnings. In the diversified financial sector, a lower P/E typically means the market may be underappreciating growth prospects, or is cautious about future risks. In this case, Financial Partners GroupLtd is valued lower than both peer (11.7x) and industry (12.2x) averages, presenting it as a notable outlier.
Looking further, the 10.6x multiple is not only below peers and industry standards but is also much lower than the estimated fair Price-to-Earnings Ratio of 18.5x. This sizable difference suggests the stock is trading at a much steeper discount than what the broader market might consider appropriate given the company’s potential.
Explore the SWS fair ratio for Financial Partners GroupLtd
Result: Price-to-Earnings of 10.6x (UNDERVALUED)
However, risks remain, including recent share price weakness and lingering market caution around Financial Partners GroupLtd’s future growth outlook.
Find out about the key risks to this Financial Partners GroupLtd narrative.
Another View: What Does the DCF Model Say?
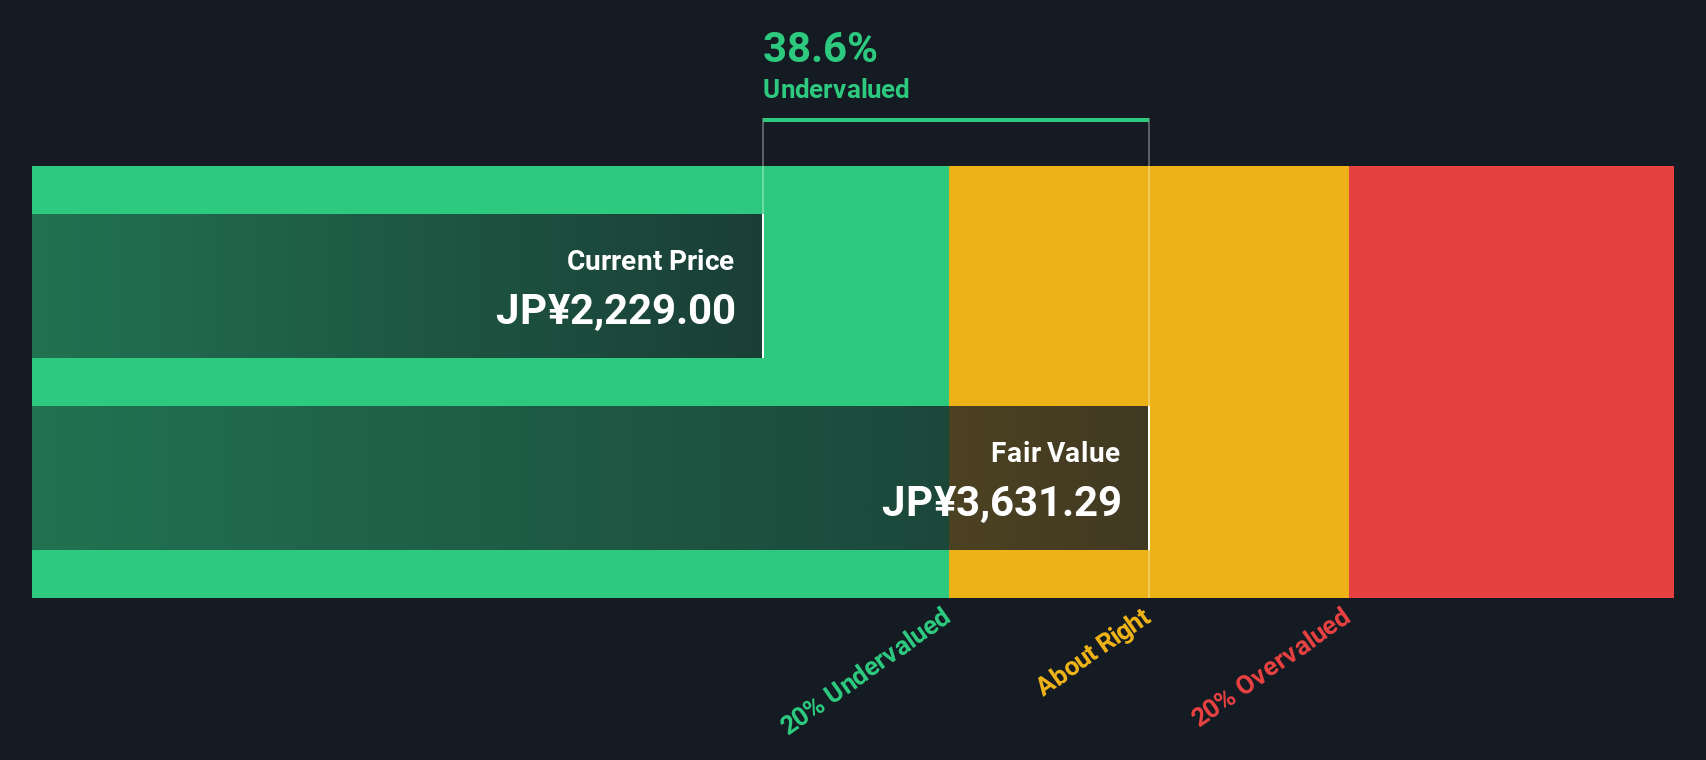
Taking a different approach, the SWS DCF model estimates Financial Partners GroupLtd’s fair value at ¥3,678, which is about 37% above the current share price. This perspective suggests the stock could be significantly undervalued, but is the market missing potential, or factoring in hidden risks?
Look into how the SWS DCF model arrives at its fair value.
Simply Wall St performs a discounted cash flow (DCF) on every stock in the world every day (check out Financial Partners GroupLtd for example). We show the entire calculation in full. You can track the result in your watchlist or portfolio and be alerted when this changes, or use our stock screener to discover 909 undervalued stocks based on their cash flows. If you save a screener we even alert you when new companies match - so you never miss a potential opportunity.
Build Your Own Financial Partners GroupLtd Narrative
If you see things differently or want to dive deeper into the numbers yourself, you can quickly craft your own perspective in just a few minutes, Do it your way
A great starting point for your Financial Partners GroupLtd research is our analysis highlighting 3 key rewards and 2 important warning signs that could impact your investment decision.
Looking for More Investment Ideas?
Thousands of investors are finding hidden gems with the Simply Wall Street Screener. Don’t miss out on the next big opportunity for your portfolio.
- Uncover growth potential by browsing these 3589 penny stocks with strong financials that combine financial strength with impressive momentum in emerging markets.
- Capitalize on artificial intelligence trends and see which companies dominate with these 26 AI penny stocks powering innovative solutions across industries.
- Boost your income strategy by targeting these 15 dividend stocks with yields > 3% delivering consistent yields above 3% for reliable returns in any market.
This article by Simply Wall St is general in nature. We provide commentary based on historical data and analyst forecasts only using an unbiased methodology and our articles are not intended to be financial advice. It does not constitute a recommendation to buy or sell any stock, and does not take account of your objectives, or your financial situation. We aim to bring you long-term focused analysis driven by fundamental data. Note that our analysis may not factor in the latest price-sensitive company announcements or qualitative material. Simply Wall St has no position in any stocks mentioned.
New: AI Stock Screener & Alerts
Our new AI Stock Screener scans the market every day to uncover opportunities.
• Dividend Powerhouses (3%+ Yield)
• Undervalued Small Caps with Insider Buying
• High growth Tech and AI Companies
Or build your own from over 50 metrics.
Have feedback on this article? Concerned about the content? Get in touch with us directly. Alternatively, email editorial-team@simplywallst.com
About TSE:7148
Financial Partners GroupLtd
Provides various financial products and services in Japan.
Undervalued with high growth potential and pays a dividend.
Market Insights

Advertisement
Community Narratives
MicroVision will explode future revenue by 380.37% with a vision towards success
Fair Value US$60.00|98.5% undervalued
TH
Community Contributor
The Indispensable Artery for a New North American Economy
Fair Value CA$132.87|2.3% undervalued
TI
Community Contributor