
Advertisement
Warren Buffett famously said, 'Volatility is far from synonymous with risk.' So it might be obvious that you need to consider debt, when you think about how risky any given stock is, because too much debt can sink a company. Importantly, FCE Inc. (TSE:9564) does carry debt. But the more important question is: how much risk is that debt creating?
When Is Debt A Problem?
Debt is a tool to help businesses grow, but if a business is incapable of paying off its lenders, then it exists at their mercy. Part and parcel of capitalism is the process of 'creative destruction' where failed businesses are mercilessly liquidated by their bankers. However, a more frequent (but still costly) occurrence is where a company must issue shares at bargain-basement prices, permanently diluting shareholders, just to shore up its balance sheet. Of course, plenty of companies use debt to fund growth, without any negative consequences. When we think about a company's use of debt, we first look at cash and debt together.
See our latest analysis for FCE
How Much Debt Does FCE Carry?
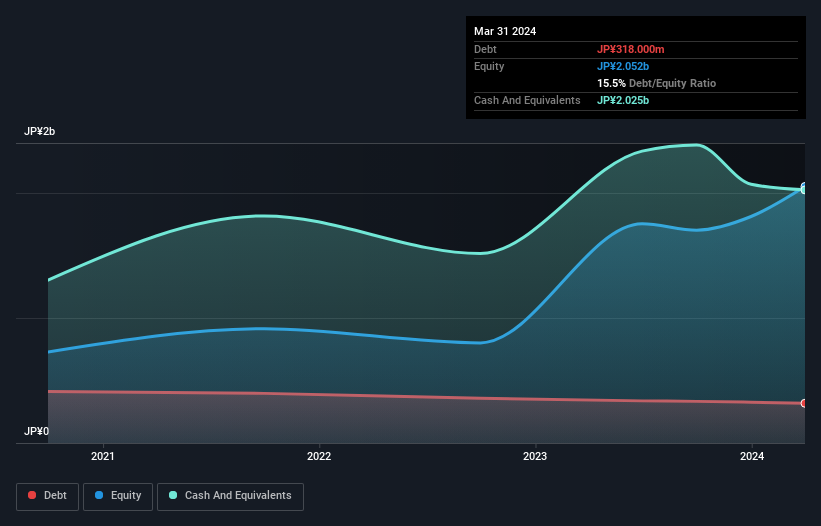
You can click the graphic below for the historical numbers, but it shows that FCE had JP¥318.0m of debt in March 2024, down from JP¥337.0m, one year before. However, its balance sheet shows it holds JP¥2.03b in cash, so it actually has JP¥1.71b net cash.
How Strong Is FCE's Balance Sheet?
Zooming in on the latest balance sheet data, we can see that FCE had liabilities of JP¥964.0m due within 12 months and liabilities of JP¥362.0m due beyond that. On the other hand, it had cash of JP¥2.03b and JP¥590.0m worth of receivables due within a year. So it can boast JP¥1.29b more liquid assets than total liabilities.
This excess liquidity suggests that FCE is taking a careful approach to debt. Due to its strong net asset position, it is not likely to face issues with its lenders. Simply put, the fact that FCE has more cash than debt is arguably a good indication that it can manage its debt safely.
In addition to that, we're happy to report that FCE has boosted its EBIT by 32%, thus reducing the spectre of future debt repayments. There's no doubt that we learn most about debt from the balance sheet. But you can't view debt in total isolation; since FCE will need earnings to service that debt. So when considering debt, it's definitely worth looking at the earnings trend. Click here for an interactive snapshot.
Finally, while the tax-man may adore accounting profits, lenders only accept cold hard cash. FCE may have net cash on the balance sheet, but it is still interesting to look at how well the business converts its earnings before interest and tax (EBIT) to free cash flow, because that will influence both its need for, and its capacity to manage debt. In the last three years, FCE's free cash flow amounted to 45% of its EBIT, less than we'd expect. That weak cash conversion makes it more difficult to handle indebtedness.
Summing Up
While we empathize with investors who find debt concerning, you should keep in mind that FCE has net cash of JP¥1.71b, as well as more liquid assets than liabilities. And we liked the look of last year's 32% year-on-year EBIT growth. So is FCE's debt a risk? It doesn't seem so to us. When analysing debt levels, the balance sheet is the obvious place to start. However, not all investment risk resides within the balance sheet - far from it. To that end, you should be aware of the 1 warning sign we've spotted with FCE .
When all is said and done, sometimes its easier to focus on companies that don't even need debt. Readers can access a list of growth stocks with zero net debt 100% free, right now.
New: AI Stock Screener & Alerts
Our new AI Stock Screener scans the market every day to uncover opportunities.
• Dividend Powerhouses (3%+ Yield)
• Undervalued Small Caps with Insider Buying
• High growth Tech and AI Companies
Or build your own from over 50 metrics.
Have feedback on this article? Concerned about the content? Get in touch with us directly. Alternatively, email editorial-team (at) simplywallst.com.
This article by Simply Wall St is general in nature. We provide commentary based on historical data and analyst forecasts only using an unbiased methodology and our articles are not intended to be financial advice. It does not constitute a recommendation to buy or sell any stock, and does not take account of your objectives, or your financial situation. We aim to bring you long-term focused analysis driven by fundamental data. Note that our analysis may not factor in the latest price-sensitive company announcements or qualitative material. Simply Wall St has no position in any stocks mentioned.
Have feedback on this article? Concerned about the content? Get in touch with us directly. Alternatively, email editorial-team@simplywallst.com
About TSE:9564
FCE
Through its subsidiaries, engages in the DX promotion, education and training, and publishing businesses in Japan.
Solid track record with excellent balance sheet.
Market Insights

Advertisement
Community Narratives
The company that turned a verb into a global necessity and basically runs the modern internet, digital ads, smartphones, maps, and AI.
Fair Value US$300.00|6.3% undervalued
OS
Community Contributor
Flowers Foods Pays A Fair Price For Health
Fair Value US$16.12|26.0% undervalued
NV
Community Contributor
TMX Group will thrive with 33.3% profit margin and enduring market moat
Fair Value CA$49.90|3.7% overvalued
LI
Community Contributor