
Key Insights
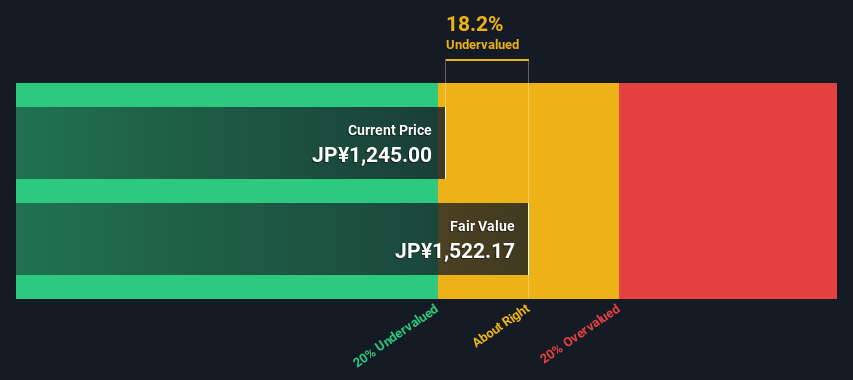
- The projected fair value for PROGRIT is JP¥1,522 based on 2 Stage Free Cash Flow to Equity
- With JP¥1,245 share price, PROGRIT appears to be trading close to its estimated fair value
- PROGRIT's peers are currently trading at a premium of 30% on average
In this article we are going to estimate the intrinsic value of PROGRIT Inc. (TSE:9560) by estimating the company's future cash flows and discounting them to their present value. We will use the Discounted Cash Flow (DCF) model on this occasion. There's really not all that much to it, even though it might appear quite complex.
We would caution that there are many ways of valuing a company and, like the DCF, each technique has advantages and disadvantages in certain scenarios. Anyone interested in learning a bit more about intrinsic value should have a read of the Simply Wall St analysis model.
See our latest analysis for PROGRIT
The Calculation
We are going to use a two-stage DCF model, which, as the name states, takes into account two stages of growth. The first stage is generally a higher growth period which levels off heading towards the terminal value, captured in the second 'steady growth' period. In the first stage we need to estimate the cash flows to the business over the next ten years. Seeing as no analyst estimates of free cash flow are available to us, we have extrapolate the previous free cash flow (FCF) from the company's last reported value. We assume companies with shrinking free cash flow will slow their rate of shrinkage, and that companies with growing free cash flow will see their growth rate slow, over this period. We do this to reflect that growth tends to slow more in the early years than it does in later years.
Generally we assume that a dollar today is more valuable than a dollar in the future, so we need to discount the sum of these future cash flows to arrive at a present value estimate:
10-year free cash flow (FCF) forecast
| 2024 | 2025 | 2026 | 2027 | 2028 | 2029 | 2030 | 2031 | 2032 | 2033 | |
| Levered FCF (¥, Millions) | JP¥832.6m | JP¥859.8m | JP¥879.9m | JP¥894.7m | JP¥905.7m | JP¥913.9m | JP¥920.1m | JP¥925.0m | JP¥928.8m | JP¥931.9m |
| Growth Rate Estimate Source | Est @ 4.60% | Est @ 3.27% | Est @ 2.34% | Est @ 1.68% | Est @ 1.23% | Est @ 0.91% | Est @ 0.68% | Est @ 0.53% | Est @ 0.42% | Est @ 0.34% |
| Present Value (¥, Millions) Discounted @ 5.0% | JP¥793 | JP¥780 | JP¥761 | JP¥737 | JP¥710 | JP¥683 | JP¥655 | JP¥627 | JP¥600 | JP¥573 |
("Est" = FCF growth rate estimated by Simply Wall St)
Present Value of 10-year Cash Flow (PVCF) = JP¥6.9b
After calculating the present value of future cash flows in the initial 10-year period, we need to calculate the Terminal Value, which accounts for all future cash flows beyond the first stage. For a number of reasons a very conservative growth rate is used that cannot exceed that of a country's GDP growth. In this case we have used the 5-year average of the 10-year government bond yield (0.2%) to estimate future growth. In the same way as with the 10-year 'growth' period, we discount future cash flows to today's value, using a cost of equity of 5.0%.
Terminal Value (TV)= FCF2033 × (1 + g) ÷ (r – g) = JP¥932m× (1 + 0.2%) ÷ (5.0%– 0.2%) = JP¥19b
Present Value of Terminal Value (PVTV)= TV / (1 + r)10= JP¥19b÷ ( 1 + 5.0%)10= JP¥12b
The total value is the sum of cash flows for the next ten years plus the discounted terminal value, which results in the Total Equity Value, which in this case is JP¥19b. To get the intrinsic value per share, we divide this by the total number of shares outstanding. Relative to the current share price of JP¥1.2k, the company appears about fair value at a 18% discount to where the stock price trades currently. The assumptions in any calculation have a big impact on the valuation, so it is better to view this as a rough estimate, not precise down to the last cent.
Important Assumptions
The calculation above is very dependent on two assumptions. The first is the discount rate and the other is the cash flows. If you don't agree with these result, have a go at the calculation yourself and play with the assumptions. The DCF also does not consider the possible cyclicality of an industry, or a company's future capital requirements, so it does not give a full picture of a company's potential performance. Given that we are looking at PROGRIT as potential shareholders, the cost of equity is used as the discount rate, rather than the cost of capital (or weighted average cost of capital, WACC) which accounts for debt. In this calculation we've used 5.0%, which is based on a levered beta of 0.855. Beta is a measure of a stock's volatility, compared to the market as a whole. We get our beta from the industry average beta of globally comparable companies, with an imposed limit between 0.8 and 2.0, which is a reasonable range for a stable business.
SWOT Analysis for PROGRIT
- Earnings growth over the past year exceeded the industry.
- Debt is not viewed as a risk.
- Shareholders have been diluted in the past year.
- Current share price is below our estimate of fair value.
- Lack of analyst coverage makes it difficult to determine 9560's earnings prospects.
- No apparent threats visible for 9560.
Moving On:
Valuation is only one side of the coin in terms of building your investment thesis, and it is only one of many factors that you need to assess for a company. DCF models are not the be-all and end-all of investment valuation. Instead the best use for a DCF model is to test certain assumptions and theories to see if they would lead to the company being undervalued or overvalued. For example, changes in the company's cost of equity or the risk free rate can significantly impact the valuation. For PROGRIT, we've compiled three further aspects you should explore:
- Risks: To that end, you should learn about the 2 warning signs we've spotted with PROGRIT (including 1 which can't be ignored) .
- Other Solid Businesses: Low debt, high returns on equity and good past performance are fundamental to a strong business. Why not explore our interactive list of stocks with solid business fundamentals to see if there are other companies you may not have considered!
- Other Top Analyst Picks: Interested to see what the analysts are thinking? Take a look at our interactive list of analysts' top stock picks to find out what they feel might have an attractive future outlook!
PS. The Simply Wall St app conducts a discounted cash flow valuation for every stock on the TSE every day. If you want to find the calculation for other stocks just search here.
The New Payments ETF Is Live on NASDAQ:
Money is moving to real-time rails, and a newly listed ETF now gives investors direct exposure. Fast settlement. Institutional custody. Simple access.
Explore how this launch could reshape portfolios
Sponsored ContentNew: Manage All Your Stock Portfolios in One Place
We've created the ultimate portfolio companion for stock investors, and it's free.
• Connect an unlimited number of Portfolios and see your total in one currency
• Be alerted to new Warning Signs or Risks via email or mobile
• Track the Fair Value of your stocks
Have feedback on this article? Concerned about the content? Get in touch with us directly. Alternatively, email editorial-team (at) simplywallst.com.
This article by Simply Wall St is general in nature. We provide commentary based on historical data and analyst forecasts only using an unbiased methodology and our articles are not intended to be financial advice. It does not constitute a recommendation to buy or sell any stock, and does not take account of your objectives, or your financial situation. We aim to bring you long-term focused analysis driven by fundamental data. Note that our analysis may not factor in the latest price-sensitive company announcements or qualitative material. Simply Wall St has no position in any stocks mentioned.
About TSE:9560
PROGRIT
Provides English coaching and subscription-based English learning services in Japan.
Outstanding track record with flawless balance sheet.
Market Insights

Weekly Picks

Early mover in a fast growing industry. Likely to experience share price volatility as they scale


A case for CA$31.80 (undiluted), aka 8,616% upside from CA$0.37 (an 86 bagger!).


Moderation and Stabilisation: HOLD: Fair Price based on a 4-year Cycle is $12.08
Recently Updated Narratives

Meta’s Bold Bet on AI Pays Off

ADP Stock: Solid Fundamentals, But AI Investments Test Its Margin Resilience

Visa Stock: The Toll Booth at the Center of Global Commerce
Popular Narratives


Crazy Undervalued 42 Baggers Silver Play (Active & Running Mine)


NVDA: Expanding AI Demand Will Drive Major Data Center Investments Through 2026

The AI Infrastructure Giant Grows Into Its Valuation
Trending Discussion


