- Japan
- /
- Hospitality
- /
- TSE:7581
Saizeriya Co.,Ltd. (TSE:7581) Stock's Been Sliding But Fundamentals Look Decent: Will The Market Correct The Share Price In The Future?


With its stock down 11% over the past week, it is easy to disregard SaizeriyaLtd (TSE:7581). But if you pay close attention, you might find that its key financial indicators look quite decent, which could mean that the stock could potentially rise in the long-term given how markets usually reward more resilient long-term fundamentals. Particularly, we will be paying attention to SaizeriyaLtd's ROE today.
Return on equity or ROE is a key measure used to assess how efficiently a company's management is utilizing the company's capital. Simply put, it is used to assess the profitability of a company in relation to its equity capital.
Check out our latest analysis for SaizeriyaLtd
How To Calculate Return On Equity?
The formula for ROE is:
Return on Equity = Net Profit (from continuing operations) ÷ Shareholders' Equity
So, based on the above formula, the ROE for SaizeriyaLtd is:
7.2% = JP¥7.7b ÷ JP¥106b (Based on the trailing twelve months to May 2024).
The 'return' is the profit over the last twelve months. One way to conceptualize this is that for each ¥1 of shareholders' capital it has, the company made ¥0.07 in profit.
What Has ROE Got To Do With Earnings Growth?
Thus far, we have learned that ROE measures how efficiently a company is generating its profits. Depending on how much of these profits the company reinvests or "retains", and how effectively it does so, we are then able to assess a company’s earnings growth potential. Assuming all else is equal, companies that have both a higher return on equity and higher profit retention are usually the ones that have a higher growth rate when compared to companies that don't have the same features.
SaizeriyaLtd's Earnings Growth And 7.2% ROE
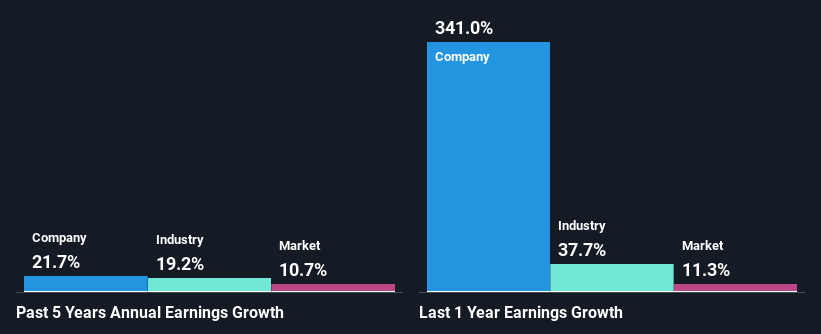
When you first look at it, SaizeriyaLtd's ROE doesn't look that attractive. Next, when compared to the average industry ROE of 12%, the company's ROE leaves us feeling even less enthusiastic. Despite this, surprisingly, SaizeriyaLtd saw an exceptional 22% net income growth over the past five years. We reckon that there could be other factors at play here. For instance, the company has a low payout ratio or is being managed efficiently.
Next, on comparing SaizeriyaLtd's net income growth with the industry, we found that the company's reported growth is similar to the industry average growth rate of 19% over the last few years.
Earnings growth is an important metric to consider when valuing a stock. What investors need to determine next is if the expected earnings growth, or the lack of it, is already built into the share price. This then helps them determine if the stock is placed for a bright or bleak future. Is 7581 fairly valued? This infographic on the company's intrinsic value has everything you need to know.
Is SaizeriyaLtd Using Its Retained Earnings Effectively?
SaizeriyaLtd's ' three-year median payout ratio is on the lower side at 17% implying that it is retaining a higher percentage (83%) of its profits. This suggests that the management is reinvesting most of the profits to grow the business as evidenced by the growth seen by the company.
Additionally, SaizeriyaLtd has paid dividends over a period of at least ten years which means that the company is pretty serious about sharing its profits with shareholders.
Conclusion
On the whole, we do feel that SaizeriyaLtd has some positive attributes. Even in spite of the low rate of return, the company has posted impressive earnings growth as a result of reinvesting heavily into its business. Having said that, looking at the current analyst estimates, we found that the company's earnings are expected to gain momentum. To know more about the latest analysts predictions for the company, check out this visualization of analyst forecasts for the company.
New: Manage All Your Stock Portfolios in One Place
We've created the ultimate portfolio companion for stock investors, and it's free.
• Connect an unlimited number of Portfolios and see your total in one currency
• Be alerted to new Warning Signs or Risks via email or mobile
• Track the Fair Value of your stocks
Have feedback on this article? Concerned about the content? Get in touch with us directly. Alternatively, email editorial-team (at) simplywallst.com.
This article by Simply Wall St is general in nature. We provide commentary based on historical data and analyst forecasts only using an unbiased methodology and our articles are not intended to be financial advice. It does not constitute a recommendation to buy or sell any stock, and does not take account of your objectives, or your financial situation. We aim to bring you long-term focused analysis driven by fundamental data. Note that our analysis may not factor in the latest price-sensitive company announcements or qualitative material. Simply Wall St has no position in any stocks mentioned.
About TSE:7581
Undervalued with solid track record.
