
Advertisement
Warren Buffett famously said, 'Volatility is far from synonymous with risk.' It's only natural to consider a company's balance sheet when you examine how risky it is, since debt is often involved when a business collapses. As with many other companies VELTRA Corporation (TSE:7048) makes use of debt. But is this debt a concern to shareholders?
When Is Debt Dangerous?
Debt and other liabilities become risky for a business when it cannot easily fulfill those obligations, either with free cash flow or by raising capital at an attractive price. If things get really bad, the lenders can take control of the business. However, a more common (but still painful) scenario is that it has to raise new equity capital at a low price, thus permanently diluting shareholders. Of course, debt can be an important tool in businesses, particularly capital heavy businesses. When we examine debt levels, we first consider both cash and debt levels, together.
View our latest analysis for VELTRA
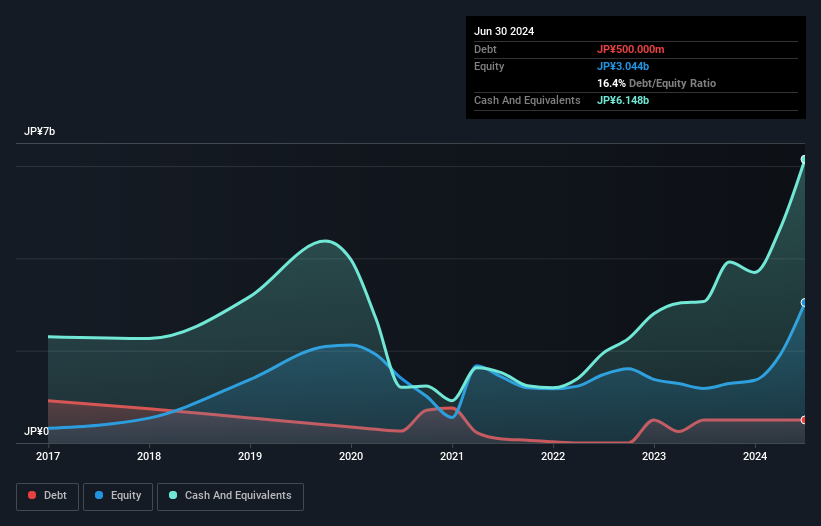
What Is VELTRA's Debt?
The chart below, which you can click on for greater detail, shows that VELTRA had JP¥500.0m in debt in June 2024; about the same as the year before. However, its balance sheet shows it holds JP¥6.15b in cash, so it actually has JP¥5.65b net cash.
A Look At VELTRA's Liabilities
We can see from the most recent balance sheet that VELTRA had liabilities of JP¥6.40b falling due within a year, and liabilities of JP¥3.00m due beyond that. Offsetting these obligations, it had cash of JP¥6.15b as well as receivables valued at JP¥2.30b due within 12 months. So it can boast JP¥2.05b more liquid assets than total liabilities.
This surplus suggests that VELTRA has a conservative balance sheet, and could probably eliminate its debt without much difficulty. Simply put, the fact that VELTRA has more cash than debt is arguably a good indication that it can manage its debt safely. There's no doubt that we learn most about debt from the balance sheet. But you can't view debt in total isolation; since VELTRA will need earnings to service that debt. So if you're keen to discover more about its earnings, it might be worth checking out this graph of its long term earnings trend.
Over 12 months, VELTRA reported revenue of JP¥3.8b, which is a gain of 92%, although it did not report any earnings before interest and tax. Shareholders probably have their fingers crossed that it can grow its way to profits.
So How Risky Is VELTRA?
Although VELTRA had an earnings before interest and tax (EBIT) loss over the last twelve months, it generated positive free cash flow of JP¥1.1b. So taking that on face value, and considering the net cash situation, we don't think that the stock is too risky in the near term. We think its revenue growth of 92% is a good sign. There's no doubt fast top line growth can cure all manner of ills, for a stock. When analysing debt levels, the balance sheet is the obvious place to start. But ultimately, every company can contain risks that exist outside of the balance sheet. Case in point: We've spotted 4 warning signs for VELTRA you should be aware of, and 1 of them is a bit concerning.
At the end of the day, it's often better to focus on companies that are free from net debt. You can access our special list of such companies (all with a track record of profit growth). It's free.
New: Manage All Your Stock Portfolios in One Place
We've created the ultimate portfolio companion for stock investors, and it's free.
• Connect an unlimited number of Portfolios and see your total in one currency
• Be alerted to new Warning Signs or Risks via email or mobile
• Track the Fair Value of your stocks
Have feedback on this article? Concerned about the content? Get in touch with us directly. Alternatively, email editorial-team (at) simplywallst.com.
This article by Simply Wall St is general in nature. We provide commentary based on historical data and analyst forecasts only using an unbiased methodology and our articles are not intended to be financial advice. It does not constitute a recommendation to buy or sell any stock, and does not take account of your objectives, or your financial situation. We aim to bring you long-term focused analysis driven by fundamental data. Note that our analysis may not factor in the latest price-sensitive company announcements or qualitative material. Simply Wall St has no position in any stocks mentioned.
About TSE:7048
VELTRA
Operates a tour and activity booking site for travelers worldwide.
Flawless balance sheet with minimal risk.
Market Insights

Advertisement
Community Narratives
MINISO's fair value is projected at 26.69 with an anticipated PE ratio shift of 20x
Fair Value US$24.03|12.0% undervalued
BE
Community Contributor
Procter & Gamble: A Dividend Giant Facing Slowing Growth
Fair Value US$119.81|21.7% overvalued
AN
Community Contributor
Eli Lilly's Future Growth Driven by Tirzepatide and Favorable Market Conditions
Fair Value US$1.19k|14.1% undervalued
EA
Community Contributor