
Advertisement
- Japan
- /
- Hospitality
- /
- TSE:3397
TORIDOLL Holdings Corporation's (TSE:3397) Intrinsic Value Is Potentially 54% Above Its Share Price
Key Insights
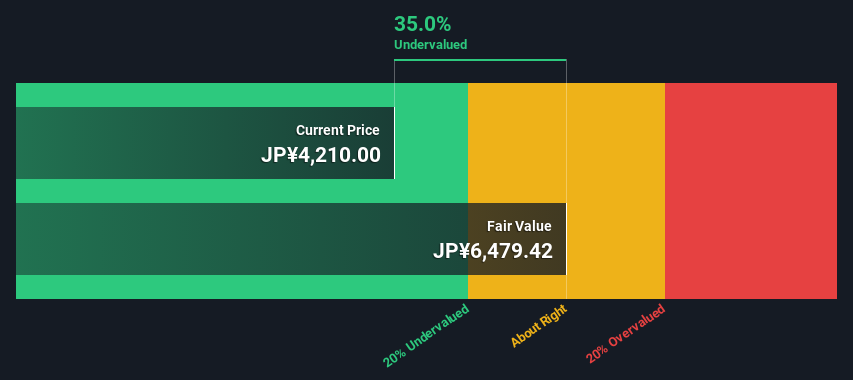
- The projected fair value for TORIDOLL Holdings is JP¥6,479 based on 2 Stage Free Cash Flow to Equity
- TORIDOLL Holdings' JP¥4,210 share price signals that it might be 35% undervalued
- The JP¥4,400 analyst price target for 3397 is 32% less than our estimate of fair value
Today we'll do a simple run through of a valuation method used to estimate the attractiveness of TORIDOLL Holdings Corporation (TSE:3397) as an investment opportunity by estimating the company's future cash flows and discounting them to their present value. We will use the Discounted Cash Flow (DCF) model on this occasion. Before you think you won't be able to understand it, just read on! It's actually much less complex than you'd imagine.
We would caution that there are many ways of valuing a company and, like the DCF, each technique has advantages and disadvantages in certain scenarios. Anyone interested in learning a bit more about intrinsic value should have a read of the Simply Wall St analysis model.
See our latest analysis for TORIDOLL Holdings
The Method
We are going to use a two-stage DCF model, which, as the name states, takes into account two stages of growth. The first stage is generally a higher growth period which levels off heading towards the terminal value, captured in the second 'steady growth' period. In the first stage we need to estimate the cash flows to the business over the next ten years. Where possible we use analyst estimates, but when these aren't available we extrapolate the previous free cash flow (FCF) from the last estimate or reported value. We assume companies with shrinking free cash flow will slow their rate of shrinkage, and that companies with growing free cash flow will see their growth rate slow, over this period. We do this to reflect that growth tends to slow more in the early years than it does in later years.
Generally we assume that a dollar today is more valuable than a dollar in the future, and so the sum of these future cash flows is then discounted to today's value:
10-year free cash flow (FCF) estimate
| 2024 | 2025 | 2026 | 2027 | 2028 | 2029 | 2030 | 2031 | 2032 | 2033 | |
| Levered FCF (¥, Millions) | JP¥14.4b | JP¥25.9b | JP¥29.8b | JP¥31.1b | JP¥40.3b | JP¥44.3b | JP¥47.3b | JP¥49.7b | JP¥51.4b | JP¥52.7b |
| Growth Rate Estimate Source | Analyst x1 | Analyst x3 | Analyst x3 | Analyst x1 | Analyst x1 | Est @ 9.84% | Est @ 6.94% | Est @ 4.90% | Est @ 3.48% | Est @ 2.48% |
| Present Value (¥, Millions) Discounted @ 7.9% | JP¥13.4k | JP¥22.3k | JP¥23.7k | JP¥23.0k | JP¥27.6k | JP¥28.1k | JP¥27.9k | JP¥27.1k | JP¥26.0k | JP¥24.7k |
("Est" = FCF growth rate estimated by Simply Wall St)
Present Value of 10-year Cash Flow (PVCF) = JP¥244b
After calculating the present value of future cash flows in the initial 10-year period, we need to calculate the Terminal Value, which accounts for all future cash flows beyond the first stage. For a number of reasons a very conservative growth rate is used that cannot exceed that of a country's GDP growth. In this case we have used the 5-year average of the 10-year government bond yield (0.2%) to estimate future growth. In the same way as with the 10-year 'growth' period, we discount future cash flows to today's value, using a cost of equity of 7.9%.
Terminal Value (TV)= FCF2033 × (1 + g) ÷ (r – g) = JP¥53b× (1 + 0.2%) ÷ (7.9%– 0.2%) = JP¥685b
Present Value of Terminal Value (PVTV)= TV / (1 + r)10= JP¥685b÷ ( 1 + 7.9%)10= JP¥322b
The total value is the sum of cash flows for the next ten years plus the discounted terminal value, which results in the Total Equity Value, which in this case is JP¥565b. The last step is to then divide the equity value by the number of shares outstanding. Compared to the current share price of JP¥4.2k, the company appears quite good value at a 35% discount to where the stock price trades currently. The assumptions in any calculation have a big impact on the valuation, so it is better to view this as a rough estimate, not precise down to the last cent.
The Assumptions
Now the most important inputs to a discounted cash flow are the discount rate, and of course, the actual cash flows. You don't have to agree with these inputs, I recommend redoing the calculations yourself and playing with them. The DCF also does not consider the possible cyclicality of an industry, or a company's future capital requirements, so it does not give a full picture of a company's potential performance. Given that we are looking at TORIDOLL Holdings as potential shareholders, the cost of equity is used as the discount rate, rather than the cost of capital (or weighted average cost of capital, WACC) which accounts for debt. In this calculation we've used 7.9%, which is based on a levered beta of 1.367. Beta is a measure of a stock's volatility, compared to the market as a whole. We get our beta from the industry average beta of globally comparable companies, with an imposed limit between 0.8 and 2.0, which is a reasonable range for a stable business.
SWOT Analysis for TORIDOLL Holdings
Strength
- Debt is not viewed as a risk.
Weakness
- Earnings growth over the past year underperformed the Hospitality industry.
- Dividend is low compared to the top 25% of dividend payers in the Hospitality market.
Opportunity
- Annual earnings are forecast to grow faster than the Japanese market.
- Trading below our estimate of fair value by more than 20%.
Threat
- Revenue is forecast to grow slower than 20% per year.
Looking Ahead:
Whilst important, the DCF calculation shouldn't be the only metric you look at when researching a company. It's not possible to obtain a foolproof valuation with a DCF model. Instead the best use for a DCF model is to test certain assumptions and theories to see if they would lead to the company being undervalued or overvalued. For instance, if the terminal value growth rate is adjusted slightly, it can dramatically alter the overall result. Can we work out why the company is trading at a discount to intrinsic value? For TORIDOLL Holdings, we've compiled three important factors you should further research:
- Risks: Be aware that TORIDOLL Holdings is showing 1 warning sign in our investment analysis , you should know about...
- Future Earnings: How does 3397's growth rate compare to its peers and the wider market? Dig deeper into the analyst consensus number for the upcoming years by interacting with our free analyst growth expectation chart.
- Other Solid Businesses: Low debt, high returns on equity and good past performance are fundamental to a strong business. Why not explore our interactive list of stocks with solid business fundamentals to see if there are other companies you may not have considered!
PS. The Simply Wall St app conducts a discounted cash flow valuation for every stock on the TSE every day. If you want to find the calculation for other stocks just search here.
Valuation is complex, but we're here to simplify it.
Discover if TORIDOLL Holdings might be undervalued or overvalued with our detailed analysis, featuring fair value estimates, potential risks, dividends, insider trades, and its financial condition.
Access Free AnalysisHave feedback on this article? Concerned about the content? Get in touch with us directly. Alternatively, email editorial-team (at) simplywallst.com.
This article by Simply Wall St is general in nature. We provide commentary based on historical data and analyst forecasts only using an unbiased methodology and our articles are not intended to be financial advice. It does not constitute a recommendation to buy or sell any stock, and does not take account of your objectives, or your financial situation. We aim to bring you long-term focused analysis driven by fundamental data. Note that our analysis may not factor in the latest price-sensitive company announcements or qualitative material. Simply Wall St has no position in any stocks mentioned.
About TSE:3397
TORIDOLL Holdings
Through its subsidiaries, operates and manages restaurants in Japan and internationally.
Excellent balance sheet with reasonable growth potential.
Similar Companies
Market Insights

Advertisement
Community Narratives
MicroVision will explode future revenue by 380.37% with a vision towards success
Fair Value US$60.00|98.4% undervalued
TH
Community Contributor
The Indispensable Artery for a New North American Economy
Fair Value CA$132.87|1.3% undervalued
TI
Community Contributor