
Advertisement
- Japan
- /
- Food and Staples Retail
- /
- TSE:2722
Slammed 29% IK HOLDINGS Co.,Ltd. (TSE:2722) Screens Well Here But There Might Be A Catch
The IK HOLDINGS Co.,Ltd. (TSE:2722) share price has fared very poorly over the last month, falling by a substantial 29%. Instead of being rewarded, shareholders who have already held through the last twelve months are now sitting on a 19% share price drop.
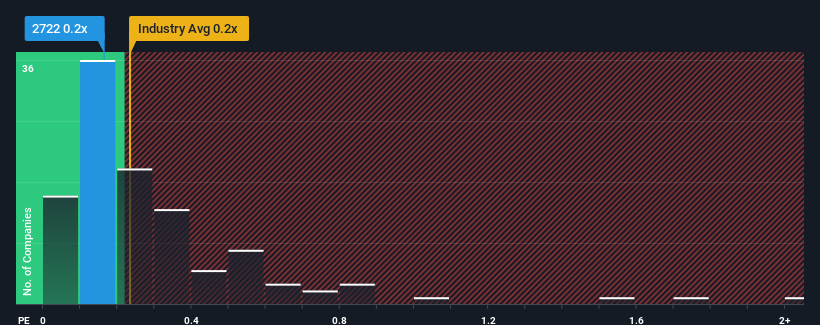
In spite of the heavy fall in price, you could still be forgiven for feeling indifferent about IK HOLDINGSLtd's P/S ratio of 0.2x, since the median price-to-sales (or "P/S") ratio for the Consumer Retailing industry in Japan is about the same. However, investors might be overlooking a clear opportunity or potential setback if there is no rational basis for the P/S.
Check out our latest analysis for IK HOLDINGSLtd
How IK HOLDINGSLtd Has Been Performing
IK HOLDINGSLtd could be doing better as its revenue has been going backwards lately while most other companies have been seeing positive revenue growth. Perhaps the market is expecting its poor revenue performance to improve, keeping the P/S from dropping. However, if this isn't the case, investors might get caught out paying too much for the stock.
Keen to find out how analysts think IK HOLDINGSLtd's future stacks up against the industry? In that case, our free report is a great place to start.What Are Revenue Growth Metrics Telling Us About The P/S?
IK HOLDINGSLtd's P/S ratio would be typical for a company that's only expected to deliver moderate growth, and importantly, perform in line with the industry.
Taking a look back first, we see that there was hardly any revenue growth to speak of for the company over the past year. Whilst it's an improvement, it wasn't enough to get the company out of the hole it was in, with revenue down 32% overall from three years ago. Therefore, it's fair to say the revenue growth recently has been undesirable for the company.
Turning to the outlook, the next year should generate growth of 8.9% as estimated by the sole analyst watching the company. With the industry only predicted to deliver 4.7%, the company is positioned for a stronger revenue result.
With this in consideration, we find it intriguing that IK HOLDINGSLtd's P/S is closely matching its industry peers. Apparently some shareholders are skeptical of the forecasts and have been accepting lower selling prices.
What Does IK HOLDINGSLtd's P/S Mean For Investors?
With its share price dropping off a cliff, the P/S for IK HOLDINGSLtd looks to be in line with the rest of the Consumer Retailing industry. While the price-to-sales ratio shouldn't be the defining factor in whether you buy a stock or not, it's quite a capable barometer of revenue expectations.
Despite enticing revenue growth figures that outpace the industry, IK HOLDINGSLtd's P/S isn't quite what we'd expect. When we see a strong revenue outlook, with growth outpacing the industry, we can only assume potential uncertainty around these figures are what might be placing slight pressure on the P/S ratio. This uncertainty seems to be reflected in the share price which, while stable, could be higher given the revenue forecasts.
Before you take the next step, you should know about the 4 warning signs for IK HOLDINGSLtd that we have uncovered.
It's important to make sure you look for a great company, not just the first idea you come across. So if growing profitability aligns with your idea of a great company, take a peek at this free list of interesting companies with strong recent earnings growth (and a low P/E).
New: AI Stock Screener & Alerts
Our new AI Stock Screener scans the market every day to uncover opportunities.
• Dividend Powerhouses (3%+ Yield)
• Undervalued Small Caps with Insider Buying
• High growth Tech and AI Companies
Or build your own from over 50 metrics.
Have feedback on this article? Concerned about the content? Get in touch with us directly. Alternatively, email editorial-team (at) simplywallst.com.
This article by Simply Wall St is general in nature. We provide commentary based on historical data and analyst forecasts only using an unbiased methodology and our articles are not intended to be financial advice. It does not constitute a recommendation to buy or sell any stock, and does not take account of your objectives, or your financial situation. We aim to bring you long-term focused analysis driven by fundamental data. Note that our analysis may not factor in the latest price-sensitive company announcements or qualitative material. Simply Wall St has no position in any stocks mentioned.
Have feedback on this article? Concerned about the content? Get in touch with us directly. Alternatively, email editorial-team@simplywallst.com
About TSE:2722
IK HOLDINGSLtd
Engages in the direct marketing, sales marketing, and IT solution businesses in Japan.
Slight risk with mediocre balance sheet.
Market Insights

Advertisement
Community Narratives
MicroVision will explode future revenue by 380.37% with a vision towards success
Fair Value US$60.00|98.4% undervalued
TH
Community Contributor
The Indispensable Artery for a New North American Economy
Fair Value CA$132.87|1.1% undervalued
TI
Community Contributor