Stock Analysis
Seiko Group Corporation's (TSE:8050) Stock Has Seen Strong Momentum: Does That Call For Deeper Study Of Its Financial Prospects?


Most readers would already be aware that Seiko Group's (TSE:8050) stock increased significantly by 20% over the past three months. Given that stock prices are usually aligned with a company's financial performance in the long-term, we decided to study its financial indicators more closely to see if they had a hand to play in the recent price move. In this article, we decided to focus on Seiko Group's ROE.
Return on equity or ROE is an important factor to be considered by a shareholder because it tells them how effectively their capital is being reinvested. In simpler terms, it measures the profitability of a company in relation to shareholder's equity.
View our latest analysis for Seiko Group
How Is ROE Calculated?
The formula for return on equity is:
Return on Equity = Net Profit (from continuing operations) ÷ Shareholders' Equity
So, based on the above formula, the ROE for Seiko Group is:
6.8% = JP¥10b ÷ JP¥151b (Based on the trailing twelve months to March 2024).
The 'return' is the profit over the last twelve months. One way to conceptualize this is that for each ¥1 of shareholders' capital it has, the company made ¥0.07 in profit.
What Is The Relationship Between ROE And Earnings Growth?
Thus far, we have learned that ROE measures how efficiently a company is generating its profits. Based on how much of its profits the company chooses to reinvest or "retain", we are then able to evaluate a company's future ability to generate profits. Assuming everything else remains unchanged, the higher the ROE and profit retention, the higher the growth rate of a company compared to companies that don't necessarily bear these characteristics.
A Side By Side comparison of Seiko Group's Earnings Growth And 6.8% ROE
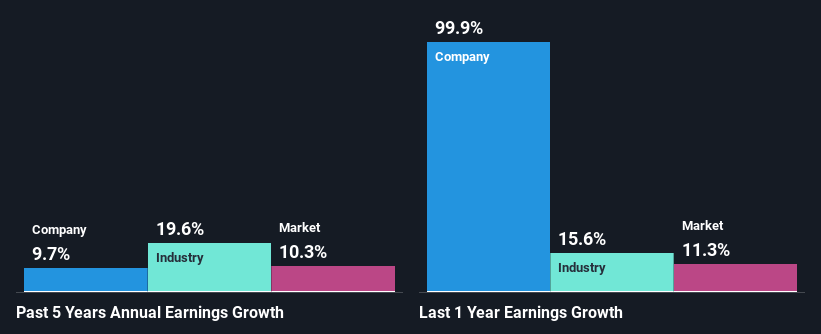
At first glance, Seiko Group's ROE doesn't look very promising. Although a closer study shows that the company's ROE is higher than the industry average of 4.7% which we definitely can't overlook. This probably goes some way in explaining Seiko Group's moderate 9.7% growth over the past five years amongst other factors. That being said, the company does have a slightly low ROE to begin with, just that it is higher than the industry average. Therefore, the growth in earnings could also be the result of other factors. Such as- high earnings retention or the company belonging to a high growth industry.
As a next step, we compared Seiko Group's net income growth with the industry and were disappointed to see that the company's growth is lower than the industry average growth of 20% in the same period.
The basis for attaching value to a company is, to a great extent, tied to its earnings growth. It’s important for an investor to know whether the market has priced in the company's expected earnings growth (or decline). Doing so will help them establish if the stock's future looks promising or ominous. If you're wondering about Seiko Group's's valuation, check out this gauge of its price-to-earnings ratio, as compared to its industry.
Is Seiko Group Making Efficient Use Of Its Profits?
Seiko Group has a healthy combination of a moderate three-year median payout ratio of 44% (or a retention ratio of 56%) and a respectable amount of growth in earnings as we saw above, meaning that the company has been making efficient use of its profits.
Additionally, Seiko Group has paid dividends over a period of at least ten years which means that the company is pretty serious about sharing its profits with shareholders.
Conclusion
Overall, we feel that Seiko Group certainly does have some positive factors to consider. Specifically, we like that the company is reinvesting a huge chunk of its profits at a respectable rate of return. This of course has caused the company to see a good amount of growth in its earnings. The latest industry analyst forecasts show that the company is expected to maintain its current growth rate. Are these analysts expectations based on the broad expectations for the industry, or on the company's fundamentals? Click here to be taken to our analyst's forecasts page for the company.
Valuation is complex, but we're helping make it simple.
Find out whether Seiko Group is potentially over or undervalued by checking out our comprehensive analysis, which includes fair value estimates, risks and warnings, dividends, insider transactions and financial health.
View the Free AnalysisHave feedback on this article? Concerned about the content? Get in touch with us directly. Alternatively, email editorial-team (at) simplywallst.com.
This article by Simply Wall St is general in nature. We provide commentary based on historical data and analyst forecasts only using an unbiased methodology and our articles are not intended to be financial advice. It does not constitute a recommendation to buy or sell any stock, and does not take account of your objectives, or your financial situation. We aim to bring you long-term focused analysis driven by fundamental data. Note that our analysis may not factor in the latest price-sensitive company announcements or qualitative material. Simply Wall St has no position in any stocks mentioned.
Valuation is complex, but we're helping make it simple.
Find out whether Seiko Group is potentially over or undervalued by checking out our comprehensive analysis, which includes fair value estimates, risks and warnings, dividends, insider transactions and financial health.
View the Free AnalysisHave feedback on this article? Concerned about the content? Get in touch with us directly. Alternatively, email editorial-team@simplywallst.com
About TSE:8050
Seiko Group
Engages in watches, devices solutions, systems solutions, apparels, clocks, fashion accessories, and other businesses in Japan and internationally.
Solid track record with excellent balance sheet and pays a dividend.
